
Nation Sites
The Nation Network
FlamesNation has no direct affiliation to the Calgary Flames, Calgary Sports and Entertainment, NHL, or NHLPA
These Calgary Flames are a more sustainable, balanced team than in 2018-19
Photo credit: Sergei Belski-USA TODAY Sports

The Calgary Flames are atop the Pacific Division and riding a pretty strong stretch of play into March. However, it’s inevitable that nervous fans’ thoughts drift back to the last edition of the team to look this impressive: the 2018-19 edition, which suffered a gutting playoff loss to Colorado that season.
When you dig into the data, particularly regarding how the coaching staff manages player usage and performance, the 2021-22 Flames are a much different team than the 2018-19 edition and it makes them a more sustainable, balanced team.
Unless otherwise noted, all data cited here are from the fine folks at Natural Stat Trick!
Goalies
Usage
2018-19 | Minutes | 2021-22 | Minutes |
Rittich | 2503 | Markstrom | 2545 |
Smith | 2400 | Vladar | 651 |
With 29 games left to go, Jacob Markstrom has already played more minutes than either of David Rittich or Mike Smith did in 2018-19. This has been my TED Talk.
But seriously, Markstrom is being ridden like he’s the top goalie. Because he’s the top goalie. But the Flames rode the heck out of Rittich early in 2018-19 (and he had legit Vezina buzz at the time) before he suffered an injury around New Year’s and his play suffered, eventually handing the net over to Smith in the second half. A cautionary tale?
Performance
2018-19 | High | Medium | Low |
Rittich | .837 | .918 | .944 |
Smith | .811 | .887 | .959 |
2021-22 | High | Medium | Low |
Markstrom | .846 | .900 | .978 |
Vladar | .753 | .910 | .971 |
Listed above are each goaltender’s all-situations high, medium and low-danger save percentages. Obvious proviso: as noted, Rittich got hurt halfway through 2018-19 and wasn’t great afterwards. But since he played through the injury, his numbers are what his numbers are.
Markstrom is being ridden like mad, but he’s the better goaltender – those high-danger numbers are night and day, albeit with Vladar having a smaller sample size than his teammate.
Defensemen
Usage
We’re looking at five-on-five average time on ice and overall average time on ice, and sorting each defensive group by their five-on-five time.
2018-19 | 5v5 Avg | Avg | 2021-22 | 5v5 Avg | Avg |
Brodie | 17:38 | 21:28 | Tanev | 16:45 | 20:38 |
Hamonic | 17:09 | 20:51 | Andersson | 16:30 | 22:21 |
Hanifin | 17:05 | 20:46 | Kylington | 16:28 | 18:31 |
Giordano | 17:03 | 24:14 | Hanifin | 16:27 | 20:52 |
Andersson | 13:51 | 16:02 | Zadorov | 15:40 | 16:46 |
Kylington* | 12:14 | 12:25 | Gudbranson | 14:53 | 18:07 |
(Oliver Kylington played the most of a cluster of sixth defenders in 2018-19 with 38 games, but Jusso Valimaki, Michael Stone, Dalton Prout and Oscar Fantenberg also slotted in. Since Kylington was the most-common sixth man, we went with him.)
Compared to 2018-19, the top two pairings are used significantly less at five-on-five, made up with the third pairing playing significantly more. It’s pretty close to the pairings being used fairly evenly at even strength, something mentioned recently by Darryl Sutter. This balance allows the team to use the blueliners a bit more strategically on special teams, rather than, say, leaning on Mark Giordano for 24 minutes a night (and sometimes more).
Player usage charts
(Via Dobber’s Frozen Tools, using Rob Vollman’s formula: the X axis is O-zone starts, the Y axis quality of competition. Higher on the Y axis means you’re facing better players, lower means weaker. A blue circle means high Corsi relative to your team, red or orange means lower.)
Here’s 2018-19 first, followed by 2021-22.
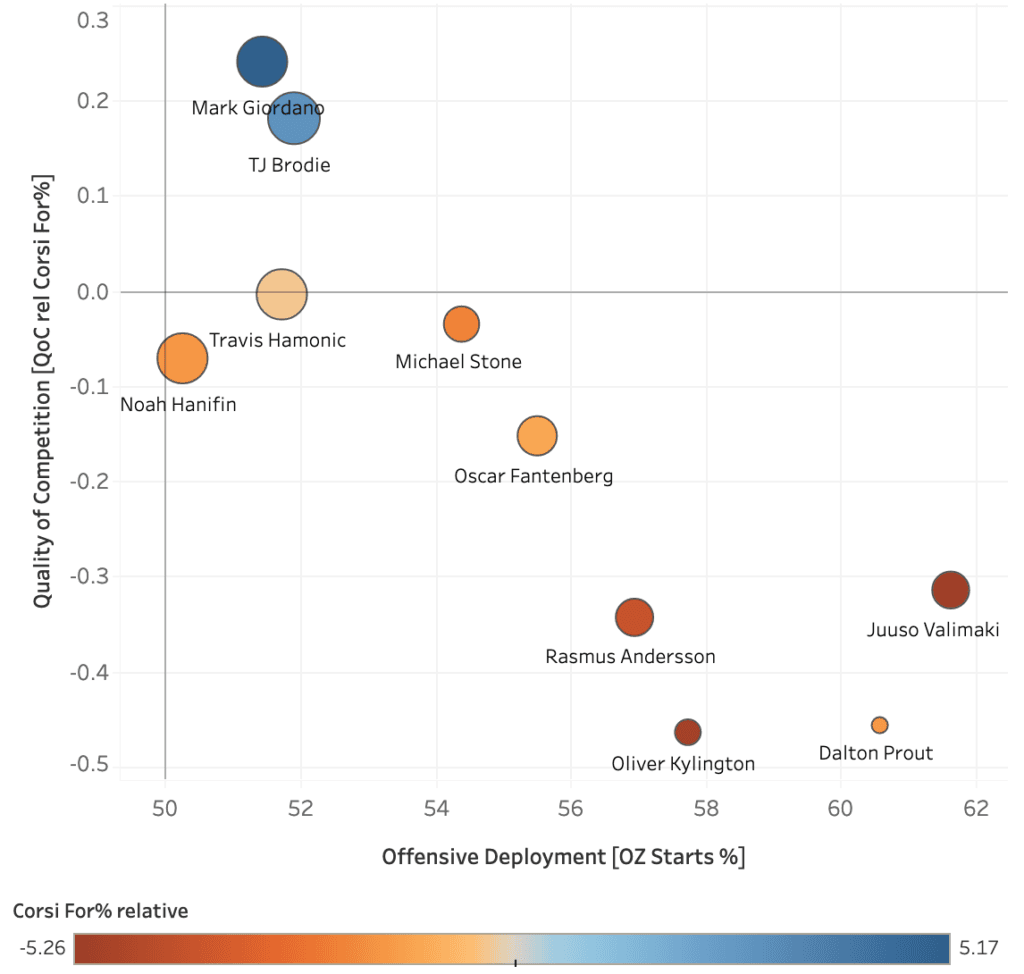
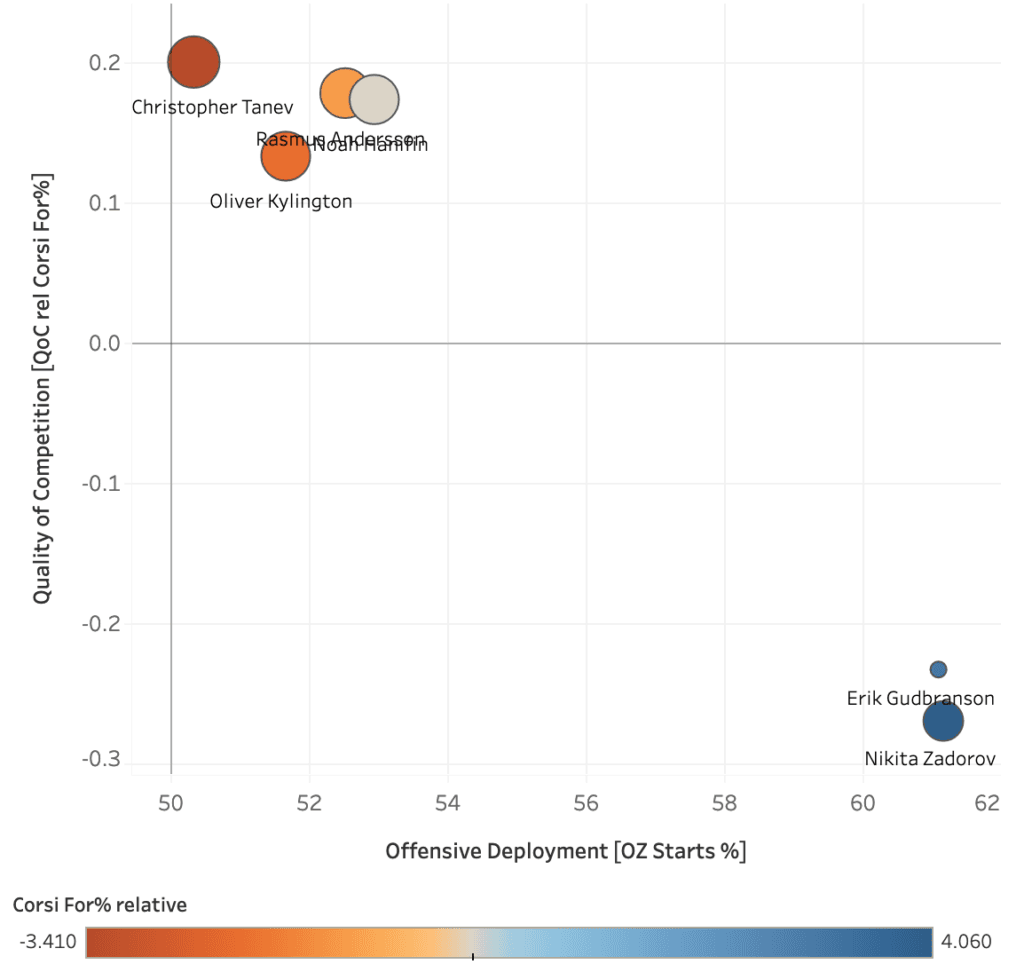
The top two pairings now are being used pretty evenly against good competition, and you could argue the two pairings are basically interchangeable. That’s a big departure from the very obvious structure they had in 2018-19.
Performance
We’re looking at expected goal rates (for and against), per 60 minutes here.
2018-19 | xGF/60 | xGA/60 | 2021-22 | xGF/60 | xGA/60 |
Brodie | 2.47 | 2.15 | Tanev | 2.68 | 2.18 |
Hamonic | 2.95 | 2.37 | Andersson | 3.06 | 2.32 |
Hanifin | 2.88 | 2.56 | Kylington | 2.75 | 2.24 |
Giordano | 2.70 | 2.11 | Hanifin | 3.04 | 2.24 |
Andersson | 2.17 | 2.06 | Zadorov | 2.77 | 2.12 |
Kylington | 2.00 | 2.20 | Gudbranson | 2.74 | 2.36 |
Team | 2.57 | 2.25 | Team | 2.83 | 2.25 |
Team-wide, the expected goals for per 60 jumped by a quarter of a goal per game, while the goals against stayed about the same. Again, the Flames play a possession game (not a defensive game) and a possession game generates offense.
The Flames are using their depth blueliners more, but they’re also getting more out of them than they were three seasons ago.
Forwards
Usage
2018-19 | 5v5 Avg | Avg | 2021-22 | 5v5 Avg | Avg |
Gaudreau | 15:26 | 20:04 | Gaudreau | 14:33 | 18:28 |
Monahan | 14:36 | 19:03 | Tkachuk | 14:19 | 17:51 |
Backlund | 14:06 | 17:53 | Lindholm | 13:58 | 20:05 |
Lindholm | 13:36 | 20:02 | Coleman | 13:03 | 15:13 |
Tkachuk | 13:32 | 17:35 | Backlund | 12:53 | 17:20 |
Frolik | 12:30 | 13:21 | Mangiapane | 12:16 | 15:53 |
Neal | 12:27 | 14:57 | Monahan | 11:34 | 14:36 |
Bennett | 11:19 | 13:17 | Toffoli | 11:27 | 14:17 |
Jankowski | 10:14 | 12:42 | Lucic | 11:06 | 12:51 |
Mangiapane | 9:52 | 10:32 | Dube | 10:48 | 12:40 |
Ryan | 9:47 | 13:48 | Lewis | 10:44 | 12:43 |
Hathaway | 8:32 | 10:31 | Richardson* | 9:27 | 9:59 |
(Brad Richardson has played the most of a cluster of fourth line players – slightly more than Adam Ruzicka or Brett Ritchie – so we’re using him here.)
As with the defense, a pattern emerges: the top players are used slightly less – Gaudreau is playing almost a minute and a half less than prior – and the lower rotation players are generally playing more. If the idea is not to burn out the top guns, but to use four lines and grind the opponents to dust: well, the data seems to bear that theory out.
You can also see the emergence of Andrew Mangiapane, the decline of Sean Monahan, and the sheer consistency of guys like Matthew Tkachuk, Elias Lindholm and Mikael Backlund in the time on ice data here.
Player usage charts
Same rules as before: 2018-19 first, then 2021-22.
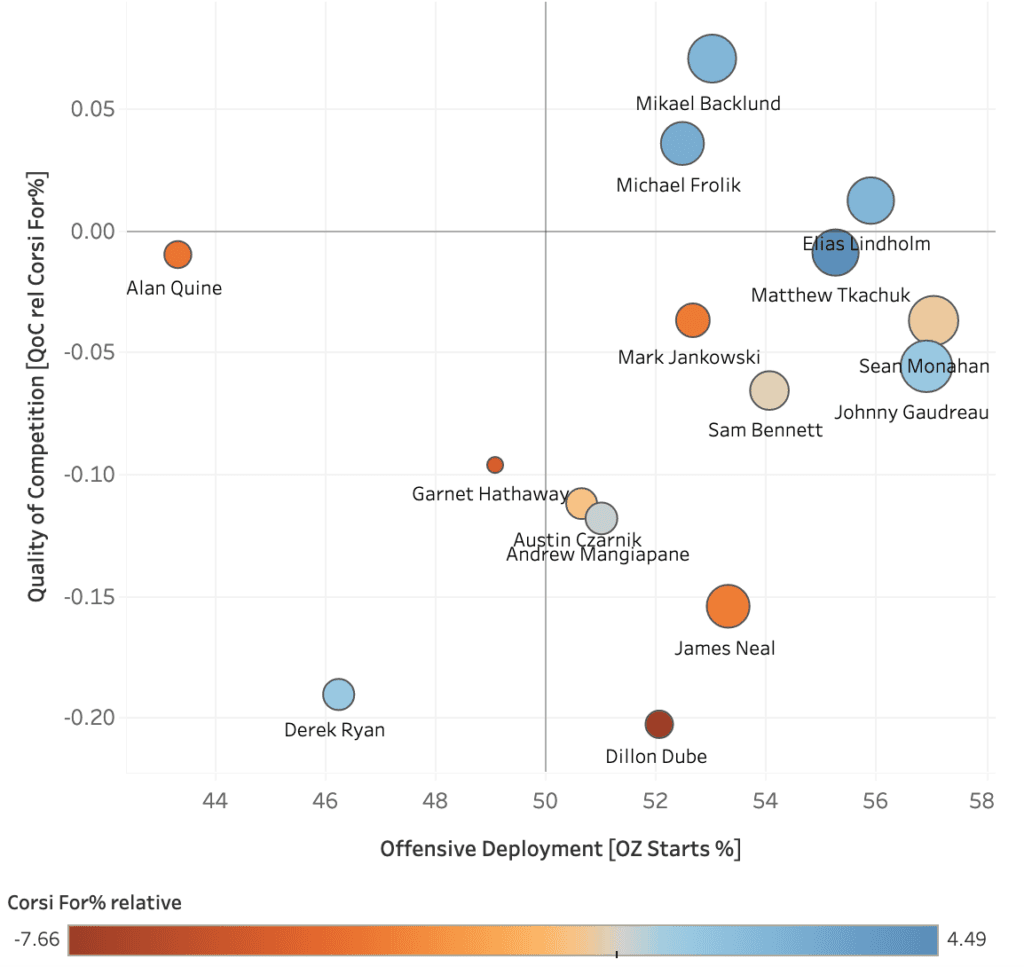
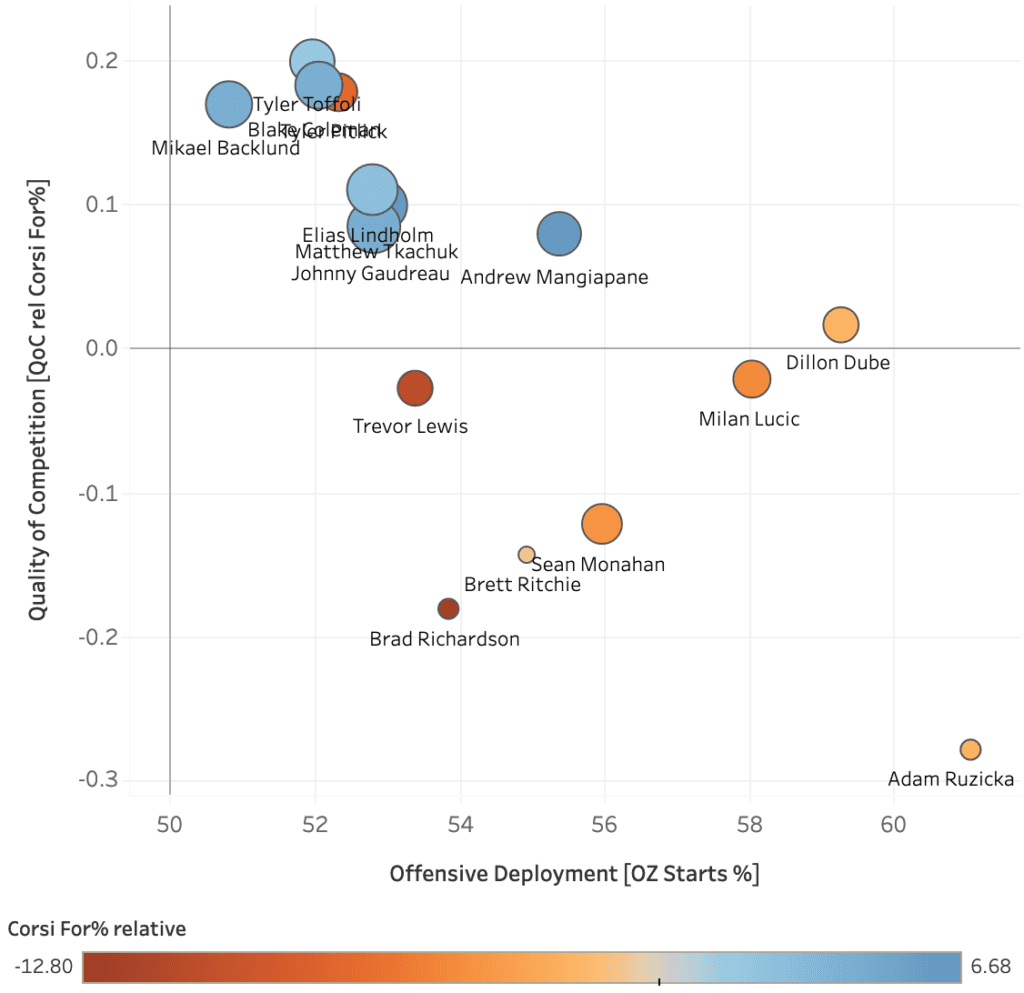
Backlund’s line is the tough minutes line, and usually plays well against tough opposition. The Gaudreau line is the secondary minutes line, and also usually plays well. The bottom six is a bit muddled, but seems a bit more coherent than in 2018-19. (And sample size alert for Tyler Toffoli.)
Performance
2018-19 | xGF/60 | xGA/60 | 2021-22 | xGF/60 | xGA/60 |
Gaudreau | 2.78 | 2.32 | Gaudreau | 3.30 | 2.29 |
Monahan | 2.77 | 2.46 | Tkachuk | 3.31 | 2.16 |
Backlund | 2.76 | 2.39 | Lindholm | 3.20 | 2.24 |
Lindholm | 2.69 | 2.22 | Coleman | 3.02 | 2.18 |
Tkachuk | 2.84 | 2.38 | Backlund | 2.90 | 2.12 |
Frolik | 2.81 | 2.30 | Mangiapane | 3.25 | 2.14 |
Neal | 2.16 | 2.30 | Monahan | 2.52 | 2.24 |
Bennett | 2.65 | 2.36 | Toffoli | 2.26 | 2.44 |
Jankowski | 2.29 | 2.09 | Lucic | 2.26 | 2.21 |
Mangiapane | 2.56 | 1.76 | Dube | 3.03 | 2.38 |
Ryan | 2.43 | 1.95 | Lewis | 2.16 | 2.47 |
Hathaway | 2.17 | 2.08 | Richardson | 1.52 | 2.38 |
Team | 2.57 | 2.25 | Team | 2.82 | 2.25 |
A general pattern here: the Flames’ depth players are a little bit worse than they were in 2018-19 – the fourth line is no great shakes – but their top players are better and arguably used in a more sustainable manner, in that the coaching staff isn’t riding the heck out of them.
As you’d expect, though, the team’s Achilles’ heel is probably a team targeting their fourth line with their top lines in road games and hammering them for scoring chances.
Aside from using Markstrom a ton, the Flames are using their players in a more balanced, sustainable manner than in 2018-19. Aside from the fourth line being a bit of a weak spot, the approach appears to be working as the team’s playing a style that maintains the defensive stinginess of the 2018-19 club but generates significantly more offense than in that edition.
What makes you optimistic about the 2021-22 edition of the Flames? What makes you nervous? Sound off in the comments!
THIS ARTICLE BROUGHT TO YOU BY DAILYFACEOFF

Looking to up your fantasy hockey game? DailyFaceoff has the tools you need for both daily and season-long fantasy leagues, including a lineup optimizer, daily projections, and a whole lot more. Sign up for the DailyFaceoff tools here.
More from FlamesNation
Breaking News
- FN AHL Report Cards: Alex Gallant was among the AHL’s penalty minutes leaders in 2025-26
- Zayne Parekh and Carson Carels headline 7 Flames on The Athletic’s top 100 prospects ranking
- Scotia Place: a street-level look at construction progress from Stampede Week 2026
- What will the Flames’ power play look like in 2026-27?
- Why Flames prospect Simon Katolicky could be the 2026 draft’s hidden gem

Calgary FlamesTeam Cap Summary

Cap Summary
2026-27
2027-28
Projected Cap Hit
$89,116,666
$70,041,666
Projected Cap Space
$14,883,334
$43,458,334
Current Cap Space
$14,883,334
$43,458,334
Active Players
23/23
16/23
Draft Picks
Round
'26
'27
1
2
1
2
3
2
3
1
2