Black Box: Goalies
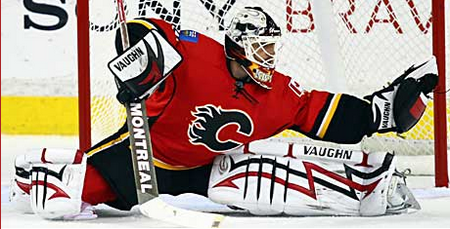
Every week this season we’ll be providing a statistical update on the Flames, broken up into four sections. First, an OZQoC chart to clarify the roles each player has been assigned, then the team’s success with them on the ice at even-strength, followed by special teams, and finally a look at the goaltending.
The decision of which statistics to include isn’t an easy one, because a lot of the traditional goaltending statistics, like goals against average, shut-outs and wins, aren’t really worth looking at. Goals against average is as much a function of how many shots the Flames are allowing as the goalie’s ability to stop them, and we already have save percentage to measure that. Shut-outs are great, but your chance of winning isn’t much different when you allow just one – consistency is far more important.
Speaking of which, wins are more a measurement of how much the Flames are scoring than how many pucks the goalies are stopping. Instead we’ll look at two statistics: Quality Starts and Even-Strength Save Percentage.
Quality starts replace wins as a way of measuring how consistently the goalie is giving the team a chance to win. They’re only awarded when they stop an above-average number of shots (91.2%), or when the team allows very few shots and they play well enough to win by allowing fewer than 3 goals, and stopping at least 88.5%. Here’s how this last section will look, using last year’s data as an example.
Goalie           GS QS  QS%  ESSV%
Miikka Kiprusoff 71 41 57.7% .916
Henrik Karlsson  11  8 72.7% .905
Save percentage is often touted as the ultimate goaltending statistic, but it’s not without its flaws. Even with Quality Start percentage helping us measure consistency, save percentage alone can easily be skewed, especially over such small sample sizes.
We’ll look only at even-strength save percentage to avoid the effect special teams play can have, but there’s little we can do to counter the way shots are recorded differently from one city to another.
Of save percentage, just remember that a lot of transient factors are involved, and it can take years to determine a goalie’s true talent level. Even Kiprusoff’s even-strength save percentage has varied wildly from .907 to .941 since the lock-out, and that’s with huge sample sizes.
Enough chit chat and preamble! Next week we’ll begin – although with just a single game’s worth of data.
This is hardly your last chance to offer suggestions, as we’ll consider this a living effort, and tune it throughout the season.
Recent articles from Robert Vollman

