Black Box: OZQoC Charts

12 years ago
An OZQoC Chart, pronounced “Oz-Coke” is a visual representation of the situations in which a team’s players are used. By combining the following two statistics, a player’s role can be determined at a glance, providing the valuable context in which his other statistics can be studied. Quite frankly, it is a necessary first step before any other statistic is even mentioned, which is why it will be the first part of our weekly Black Box statistical summaries this season.
OZ refers to Offensive Zone Starts – the percentage of a player’s shifts that begin in the offensive zone at even strength, not counting on-the-fly changes. Naturally most players will hover around 50% but in extreme cases, like the Vancouver Canucks for instance, players like Manny Malhotra could be as low as 30% so that the Sedin twins can start 70% of their shifts facing the opposing goalie.
A high offensive zone start percentage says that your coach either doesn’t trust you in your own zone, or that he really wants your offensive talents in the offensive zone as much as possible – or both. It is very important when looking at shot-based metrics, since starting in the offensive zone a lot will artificially bloat your numbers.
QoC refers to Quality of Competition, or Relative Quality of Competition to be exact. This is simply the average plus/minus of your opponents per 60 minutes, except instead of using goals, it uses a shot-based metric called Corsi, and recorded relative to one’s teammates. A high QoC of 1.00 means the players that skater typically faces generate one more attempted shot per 60 minutes than their opponents, on average. The top players all have high Quality of Competition, because generally top lines face other top lines.
Check out the OZQoC charts generated for the Winnipeg Jets, Detroit Red Wings, Philadelphia Flyers and Columbus Blue Jackets to get a sense of the various OZQoC Chart formats, and we’ll look at Calgary’s right after the jump.
Defensemen
Here is the OZQoC Chart for all Calgary Flames defensemen who played at least 15 games last year (so no T.J. Brodie or Derek Smith).
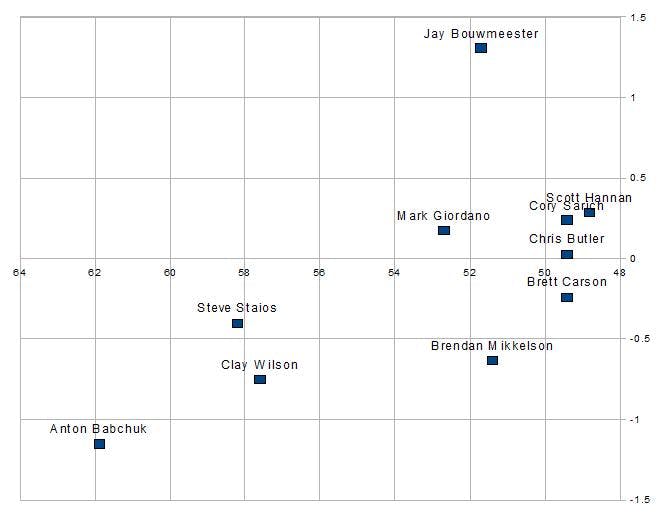
If you draw a line from the top-right corner to the bottom-left you generally get a linear idea of who gets the toughest ice-time.
There’s no question that Jay Bouwmeester gets the toughest ice-time, and in Robyn Regehr’s absence, next is Scott Hannan, Cory Sarich, Chris Butler, Mark Giordano and Brett Carson in a pretty tight cluster. After that you get Brendan Mikkelson, the unsigned Steve Staios, Clay Wilson and finally Anton Babchuk bringing up the far rear.
Consequently, Bouwmeester’s accomplishments should be held in higher esteem, and Anton Babchuk’s virtually dismissed, and with knowledge of the two separate tiers of defensemen in between.
Forwards
Here are the Flames forwards, with a minimum 12 games so we can include Guillaume Desbiens, but not Raitis Ivananas, Pierre-Luc Letourneau-Leblond-LePew, or Paul Byron.
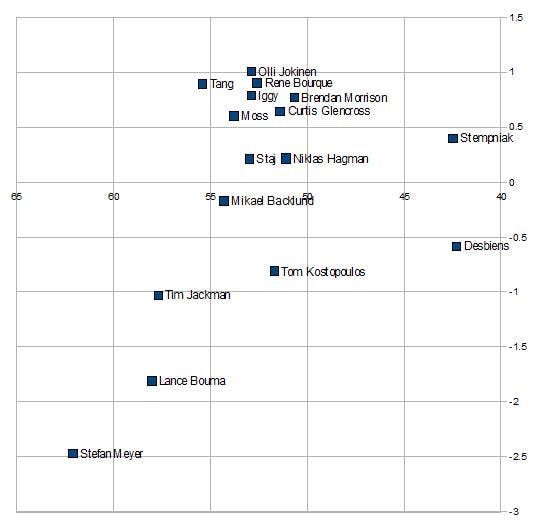
With the exception of fourth-line players like Tim Jackman and Tom Kostopoulos, coach Brent Sutter doesn’t specialize the lines, essentially throwing them all into equivalent situations. That makes it easier to compare their statistics on a generally equal basis, knowing that very few players have the advantage of easier ice-time.
Olli Jokinen, Brendan Morrison, Rene Bourque, Jarome Iginla, Curtis Glencross, Alex Tanguay and David Moss all played comparably-difficult even-strength ice-time, with Niklas Hagman and Matt Stajan not far behind.
It will be interesting to see how Sutter uses Lee Stempniak, who is used to being assigned a role where he plays the tougher minutes to create more favourable match-ups for the top units. It will also be interesting to see if Mikael Backlund remains sheltered, or eases into the same role as the others.
Next week
With this context in mind, we’ll look at the even-strength goal, shot and scoring chances differentials per 60 minutes, knowing that Bouwmeester’s are going to be like a car’s sideview mirror, and his numbers are actually better than they appear.
Recent articles from Robert Vollman