Black Box: Week 22

12 years ago
Probability of making the post-season, three different sites. Doesn’t include Sunday’s games.
Team         1   2   3
Chicago     88% 87% 83%
Phoenix     84% 86% 78%
San Jose    74% 80% 72%
Dallas      63% 60% 67%
Los Angeles 43% 48% 36%
Calgary     24% 23% 28%
Colorado    18% 13% 28%
OZQoC Charts (explanation)
Changes to player usage over time has included Roman Horak and Lance Bouma being gradually but inevitably transitioned into softer roles, in favour of players like Blake Comeau and Lee Stempniak (when he was in the line-up).
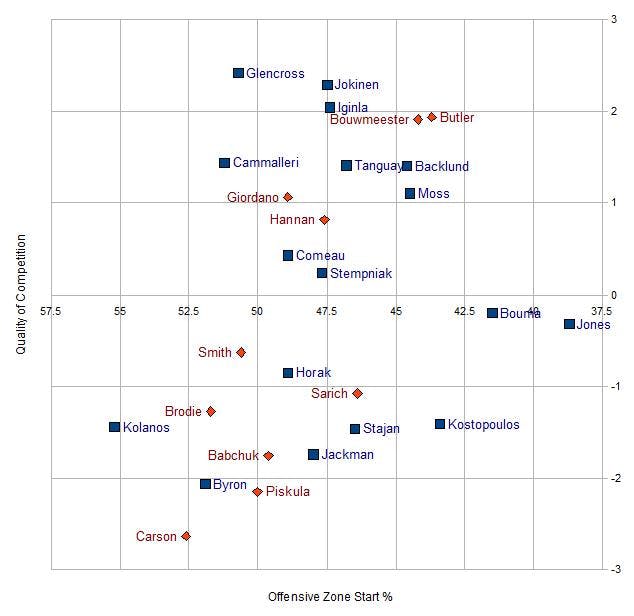
The veteran fourth line of Tim Jackman, Matt Stajan and Tom Kostopoulos have been used more defensively, so as to yield the more sheltered situations to Krys Kolanos, Paul Byron and Roman Horak.
Even-Strength Scoring (explanation)
When someone in Calgary’s top-six is on the ice (other than Backlund), Calgary will average 47 shots per 60 minutes at even-strength – that appears to be a constant. What varies is how many of those shots will be converted into scoring chances and/or goals, and how many shots the Flames will face.
For example, Calgary converts far more of their shots into scoring chances with Alex Tanguay (and far less with Curtis Glencross), and opponents get more shots, chances and goals against Jarome Iginla and Olli Jokinen.
Top-Six Forward ESP/60 CEF CEA  CE% SCF SCA SC%   GF   GA    G%
Mikael Backlund  0.9   53  50 51.6% 16 14 51.7% 1.57 2.92  35.0%
Mike Cammalleri  1.7   48  55 46.7% 16 21 43.2% 2.35 2.88  44.9%
Curtis Glencross 2.1   47  58 45.1% 14 17 43.9% 2.72 2.98  47.7%
Alex Tanguay     2.3   47  58 44.9% 18 17 51.5% 2.90 2.36  55.1%
Jarome Iginla    2.0   47  60 44.0% 16 19 46.3% 2.49 2.78  47.2%
Olli Jokinen     2.1   47  60 43.8% 15 19 44.9% 3.11 2.80  52.6%
Replacement-level scoring levels for a Calgary depth forward is in the 0.7 to 0.9 range (of even-strength points per 60 minutes), suggesting that David Moss and Lee Stempniak are usable second-line forwards and great third-liners.
3rd Line Forward ESP/60 CEF CEA  CE% SCF SCA SC%   GF   GA    G%
David Moss       1.6   56  50 52.8% 11 15 43.2% 1.63 1.63  50.0%
Lee Stempniak    1.9   54  51 51.3% 16 15 51.7% 2.61 2.70  49.2%
Blake Comeau     0.8   49  52 48.9% 13 15 46.1% 1.19 2.24  34.7%
Lance Bouma      0.8   43  55 44.1% 13 12 51.6% 0.82 2.18  27.3%
Blair Jones      0.9   44  52 45.7% 19 19 50.6% 1.11 1.29  46.3%
That veteran fourth line of Matt Stajan, Tim Jackman and Tom Kostopoulos reminds me more and more like my stock portfolio. Despite the underlying numbers being decent (shot and scoring chance data), the key value (goal data) somehow goes from awful to worse-than-awful week-by-week.
The biggest difference on these depth lines is that Calgary enjoys far more shots, but far fewer of them get converted into scoring chances, and then even fewer of those into goals. I suppose that makes sense.
Depth Forward  ESP/60 CEF CEA  CE% SCF SCA SC%   GF   GA    G%
Matt Stajan      0.9   51  49 51.0% 12 13 48.7% 1.34 2.82  32.2%
Tim Jackman      0.7   49  48 50.5% 11 12 48.4% 0.83 2.70  23.5%
Krys Kolanos     0.7   50  53 48.7% 11 10 51.6% 1.35 1.35  50.0%
Tom Kostopoulos  0.7   50  53 48.2% 12 13 47.5% 1.50 2.74  35.4%
Greg Nemisz      0.0   34  43 44.5%  4  9 33.3% 0.00 0.00   0.0%
Roman Horak      1.2   41  52 44.2% 12 12 51.5% 1.88 1.41  57.1%
P-L. Leblond     0.0   46  58 43.9%  8 12 40.0% 4.16 0.00 100.0%
Paul Byron       1.1   35  51 41.1% 11 11 51.3% 1.63 0.54  75.1%
G. Desbiens      0.0   27  45 37.5%  5  5 50.0% 0.00 0.00   0.0%
Raitis Ivanans   0.0   27  65 29.4%  5 27 16.7% 0.00 5.41   0.0%
Think there’s a difference in the offensive abilities of Calgary’s top four defensemen? At even-strength, apparently not. A lot of the underlying numbers are out of their hands. Even with the reduced number of shots and chances with Scott Hannan on the ice, for example, Calgary still scores that same 2.15 goals per 60 minutes.
Top-4 Defense  ESP/60 CEF CEA  CE% SCF SCA SC%   GF   GA    G%
Chris Butler     0.6   49  57 46.3% 16 18 47.7% 2.42 2.42  50.0%
Jay Bouwmeester  0.6   48  57 45.9% 15 18 45.9% 2.12 2.55  45.4%
Mark Giordano    0.6   47  57 45.3% 14 15 47.0% 2.15 2.23  49.1%
Scott Hannan     0.5   43  56 43.6% 13 17 43.1% 2.15 2.73  44.1%
It was a really bad week for Derek Smith, with sharp decreases in all three percentages.
Depth Defense  ESP/60 CEF CEA  CE% SCF SCA SC%   GF   GA    G%
Brett Carson     0.0   70  41 63.4% 19 11 63.6% 0.00 5.41   0.0%
T.J. Brodie      0.6   49  47 51.2% 14 13 52.9% 2.37 2.12  52.8%
Cory Sarich      0.4   48  48 49.7% 13 12 52.0% 1.76 2.11  45.5%
Derek Smith      0.7   49  53 48.0% 14 13 52.1% 1.81 2.03  47.1%
Joe Piskula      0.0   50  59 45.9% 19 14 56.7% 0.00 5.54   0.0%
Anton Babchuk    0.9   39  60 39.8%  8 17 32.5% 1.45 1.74  45.5%
Clay Wilson      0.0   29  48 37.5%  5 12 28.6% 0.00 0.00   0.0%
Special teams (explanation)
Calgary has a league-average power play, thanks to the big-name veteran likes of Jarome Iginla, Mike Cammalleri, Olli Jokinen and Alex Tanguay. However, they don’t seem to take very many shots.
Primary Forwards    TOI/GP PTS/60 CE/60
Mike Cammalleri      2.9     2.8   94.3
Olli Jokinen         3.1     5.4   81.5
Jarome Iginla        3.3     4.2   80.6
Alex Tanguay         3.3     4.5   78.5
Despite the high number of shots taken with David Moss on the power play he has yet to register a point with the man advantage himself. Contrast that with Curtis Glencross and his team-leading power play scoring rate, and yet with him on the ice the team is least likely to take a shot.
Secondary Forwards  TOI/GP PTS/60 CE/60
David Moss           1.4     0.0   90.4
Mikael Backlund      1.1     3.9   85.0
Lee Stempniak        1.7     2.0   78.6
Krys Kolanos         1.2     0.0   71.2
Curtis Glencross     1.9     6.3   67.4
Blake Comeau and Tim Jackman got a little time on the power play this week, but both players are still looking for their first points.
Depth Forwards     TOI/GP PTS/60  CE/60
Roman Horak          0.5     0.0   84.9
Tim Jackman          0.4     0.0   75.2
Blair Jones          0.8     2.2   73.6
Blake Comeau         0.7     0.0   59.9
Finally, here’s a look at how Calgary’s defensemen do with the man advantage.
Defensemen          TOI/GP PTS/60 CE/60
Clay Wilson          2.5     0.0  130.7
Anton Babchuk        1.9     3.8   99.5
Jay Bouwmeester      2.3     3.6   80.7
Chris Butler         0.7     2.9   79.7
Mark Giordano        3.3     2.5   76.4
T.J. Brodie          1.8     3.9   69.0
Derek Smith          1.3     5.2   66.3
Penalty killing!
Game 62, Tom Kostopoulos scored Calgary’s first short-handed goal of the season to secure a 3-0 lead over Philadelphia, a game they would unfortunately lose 5-4 in a shoot-out. Just two games later, Curtis Glencross bagged the team’s 2nd short-handed marker of the season to go up 2-0 on Phoenix. Fortunately that time their 3-0 lead (Olli Jokinen scored a minute and a half later) just barely held up – Jarome added an empty netter.
Primary Forwards TOI/GP CE/60
Lee Stempniak     1.7    76.2
Blake Comeau      1.2    78.5
Curtis Glencross  2.2    84.6
Mikael Backlund   1.0    90.5
Tom Kostopoulos   1.4    90.9
David Moss        1.5   124.9
Due to the high volume of penalties taken this week, highly-paid veterans Alex Tanguay, Olli Jokinen and Matt Stajan saw a lot of action – and Kipper and Irving consequently saw a lot of shots.
Depth Forwards   TOI/GP CE/60
Mike Cammalleri   0.7    68.9
Blair Jones       0.6    79.7
Alex Tanguay      1.1    84.0
Olli Jokinen      0.5    90.3
Roman Horak       0.2   115.8
Lance Bouma       0.4   121.9
Matt Stajan       0.9   120.5
Chris Butler’s out of the line-up, placing a heavier burden on the remaining three primary penalty killers.
Primary Defense  TOI/GP CE/60
Scott Hannan      2.7    84.7
Mark Giordano     2.0    85.3
Chris Butler      2.2    92.2
Jay Bouwmeester   3.3    92.3
With Butler down for the count, and having to kill so many penalties this week, Brent Sutter decided to add Cory Sarich to the short-handed rotation rather than rotate three defensemen, as he did earlier in the season when Mark Giordano was out. Given his success in limited action, Derek Smith might be worth a try instead.
Depth Defense    TOI/GP CE/60
Derek Smith       0.4    60.6
Cory Sarich       0.7   101.5
Brett Carson      0.3   109.1
Goaltending (explanation)
Despite playing well enough for Calgary to win in 5 of his 6 starts, Leland Irving has just a single victory – fortunately they haven’t hung Miikka Kiprusoff out to dry quite as badly. It’s a shame the team isn’t taking full advantage of what could be Kiprusoff’s final top-ten-calibre season. Had he played this way last year, Calgary may have pushed Vancouver for the division title.
Goalie           GS QS   QS%  ESSV%
Miikka Kiprusoff 54 33  61.1%  .929
Leland Irving     6  5  83.3%  .919
Henrik Karlsson   5  1  20.0%  .906
And that’s how it looks under the hood after 22 weeks. Calgary hosts a key game against Dallas after this is written but before it’s published, followed by Montreal and Winnipeg. Since the snowfall will help the Jets feel at home, let’s help the Habs by chanting a song from another continent and a completely different sport.
Recent articles from Robert Vollman