Black Box: Week 23

12 years ago

Sven Baertschi got his opportunity when nine men were simultaneously unavailable. I know exactly how he felt, thanks to my dating history.
As of Saturday night’s games, and thanks to their overtime victory over the Flames, Dallas jumped up the list in the playoff probability picture, practically in clinch territory with the Chicago Blackhawks.
Team         1   2   3
Chicago     93% 93% 91%
Dallas      90% 91% 92%
Phoenix     71% 69% 63%
San Jose    62% 58% 56%
Calgary     33% 32% 39%
Los Angeles 30% 29% 24%
Colorado    20% 28% 34%
OZQoC Charts (explanation)
Normally we have a 5-game minimum for the OZQoC chart, to avoid stretching it out to include the sheltered players, so we can have a closer look at Calgary’s regulars. However, given their recent injuries and the influx of new players we thought we’d pretend this was a small-market American team in the play-offs and bend the rules just a little bit.
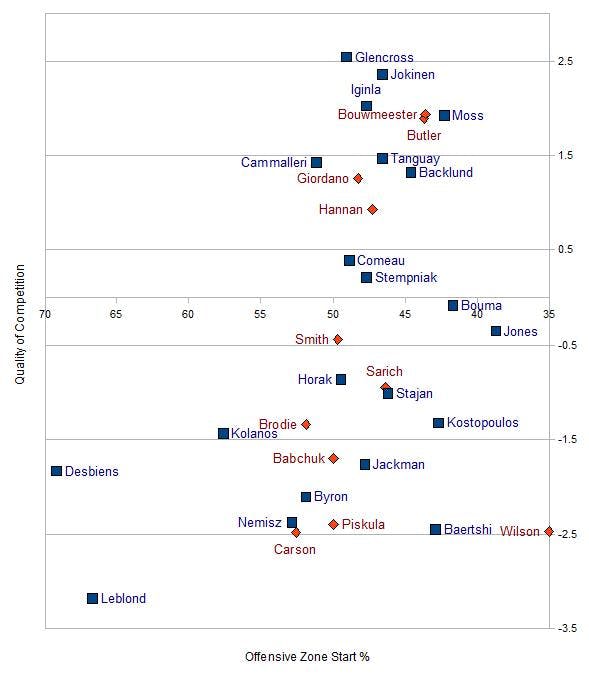
We still didn’t include Raitis Ivanans, because that would stretch the chart to the point of ridiculousness, but based on fellow tough guys Guillaume Desbiens and Pierre-Luc Letourneau Leblond you can get an idea of where he’d fall.
You can also see why we moved David Moss up to the top-six this week and why Roman Horak has always been down among the depth forwards. In fact, given this influx, there’s now a new level below the Stajan/Kostopoulos level.
Even-Strength Scoring (explanation)
Curtis Glencross and his amazing league-leading 26.4% shooting percentage gives the Flames a complete line of players with scoring rates higher than Jarome Iginla’s.
Alex Tanguay is the true offensive catalyst, taking the 48 attempted shots per 60 minutes that the Flames enjoy regardless of which of their top-six forwards are on the ice (Backlund and Moss notwithstanding) and converting them into 19 scoring chances per 60 minutes, resulting in a huge scoring edge for the Flames, who are responsible for over 55% of the scoring when he’s on the ice. As my cleaning lady says when I ask her if I need any more supplies – Fantastik!
Top-Six Forward ESP/60 CEF CEA  CE% SCF SCA SC%   GF   GA    G%
Mikael Backlund  0.9   53  50 51.6% 16 14 51.7% 1.57 2.92  35.0%
David Moss       1.9   55  52 51.0% 12 16 43.3% 2.12 1.59  57.1%
Mike Cammalleri  1.7   48  55 46.8% 17 22 43.9% 2.37 2.81  45.8%
Alex Tanguay     2.4   48  58 45.2% 19 18 51.4% 3.02 2.44  55.3%
Curtis Glencross 2.3   48  58 45.1% 14 18 44.0% 2.88 2.96  49.3%
Jarome Iginla    2.1   48  60 44.2% 17 19 46.5% 2.63 2.90  47.6%
Olli Jokinen     2.1   47  60 43.9% 15 19 44.8% 3.14 2.90  52.0%
Calgary essentially have no third-line forwards right now, except Lance Bouma – skip this (if you haven’t been skipping this whole article already).
3rd Line Forward ESP/60 CEF CEA  CE% SCF SCA SC%   GF   GA    G%
Lee Stempniak    1.9   54  51 51.3% 16 15 51.7% 2.61 2.70  49.2%
Blake Comeau     0.8   49  52 48.9% 13 15 46.1% 1.19 2.24  34.7%
Lance Bouma      0.8   43  54 44.0% 13 12 51.6% 0.80 2.13  27.3%
Blair Jones      0.9   44  52 45.7% 19 19 50.6% 1.11 1.29  46.3%
It was a big week for Greg Nemisz, capping off a good week by the depth lines over-all: Krys Kolanos, Matt Stajan, and Guillaume Desbiens all played above their norm, holding their own against 3rd and 4th line opponents. Unfortunately Sven Baertschi was dominated as badly as I usually am when I get my shot, but got a fair bit more luck than I ever had.
Depth Forward  ESP/60 CEF CEA  CE% SCF SCA SC%   GF   GA    G%
Greg Nemisz      0.0   48  44 52.2% 14 12 53.8% 1.98 0.00 100.0%
Krys Kolanos     0.6   53  51 50.8% 11 11 50.0% 1.14 1.14  50.0%
Tim Jackman      0.7   50  48 50.6% 11 12 48.9% 0.81 2.64  23.5%
Matt Stajan      1.2   51  50 50.2% 13 13 48.4% 1.57 2.66  37.1%
G. Desbiens      0.0   41  44 47.8%  7  9 44.4% 0.00 0.00   0.0%
Tom Kostopoulos  0.7   49  54 47.7% 12 13 47.4% 1.41 2.66  34.6%
Roman Horak      1.1   41  52 44.3% 12 12 51.2% 1.80 1.46  55.2%
P-L. Leblond     0.0   46  58 43.9%  8 12 40.0% 4.16 0.00 100.0%
Paul Byron       1.1   35  51 41.1% 11 11 51.3% 1.63 0.54  75.1%
Sven Baertshi    0.0   33  59 35.7% 26 13 66.7% 0.00 0.00   0.0%
Raitis Ivanans   0.0   27  65 29.4%  5 27 16.7% 0.00 5.41   0.0%
The fundamental problem with the Calgary Flames is how their top-six up front and their front-four down back get dominated possession-wise by their opponents. Calgary enjoys only 45% of on-ice attempted shots when top players are on the ice. We wonder how much this would improve if Jay Bouwmeester and Mark Giordano had stronger linemates (perhaps: each other?).
Top-4 Defense  ESP/60 CEF CEA  CE% SCF SCA SC%   GF   GA    G%
Chris Butler     0.6   49  57 46.3% 16 18 47.7% 2.42 2.42  50.0%
Jay Bouwmeester  0.6   48  57 45.8% 15 17 46.4% 2.11 2.61  44.7%
Mark Giordano    0.7   47  57 45.3% 14 16 46.4% 2.38 2.31  50.7%
Scott Hannan     0.5   43  57 43.4% 13 18 42.6% 2.32 2.71  46.1%
Unfortunately there’s no one right now among their depth defensemen who would necessarily do a better job than Chris Butler or Scott Hannan – though there’s long-term potential for T.J. Brodie.
Depth Defense  ESP/60 CEF CEA  CE% SCF SCA SC%   GF   GA    G%
Brett Carson     0.0   70  41 63.4% 19 11 63.6% 0.00 5.41   0.0%
T.J. Brodie      0.6   50  47 51.5% 15 13 53.3% 2.40 2.02  54.3%
Cory Sarich      0.4   49  48 50.2% 13 12 52.5% 1.79 1.96  47.7%
Derek Smith      0.6   48  54 47.3% 14 13 51.7% 1.67 2.19  43.3%
Joe Piskula      0.0   50  59 45.9% 19 14 56.7% 0.00 5.54   0.0%
Anton Babchuk    0.9   40  59 40.4%  8 17 31.3% 1.42 1.70  45.5%
Clay Wilson      0.0   29  48 37.5%  5 12 28.6% 0.00 0.00   0.0%
Special teams (explanation)
Cammalleri’s absence could sting on the power play, as they get far more shots with him on the usual one-and-a-third per minute with anyone else. Olli Jokinen’s power play scoring rate is once again poised to be Calgary’s best (among their primary options).
Primary Forwards    TOI/GP PTS/60 CE/60
Mike Cammalleri      2.9     2.8   94.1
Olli Jokinen         3.1     6.0   80.8
Jarome Iginla        3.3     4.3   80.1
Alex Tanguay         3.3     5.0   78.0
Curtis Glencross has scored at an incredible rate all season despite the team’s inability to get the puck on next when he’s on the ice, barely a shot per minute!
Secondary Forwards  TOI/GP PTS/60 CE/60
Mikael Backlund      1.1     3.9   85.0
David Moss           1.3     0.0   83.3
Lee Stempniak        1.7     2.0   78.6
Krys Kolanos         1.1     0.0   68.4
Curtis Glencross     1.9     6.5   66.1
Calgary’s defensemen all score at roughly the same rate with the man advantage, with Chris Butler trailing slightly behind and Derek Smith getting an extra few lucky ones. That being said, they don’t get the same volume of shots with Brodie and Smith out there, and have a slight edge with a specialist like Babchuk.
Defensemen          TOI/GP PTS/60 CE/60
Clay Wilson          2.5     0.0  130.7
Anton Babchuk        1.9     3.6   97.2
Jay Bouwmeester      2.3     3.5   79.8
Chris Butler         0.7     2.9   79.7
Mark Giordano        3.2     3.2   75.8
T.J. Brodie          1.7     3.9   68.0
Derek Smith          1.2     5.2   66.3
Penalty killing
The biggest impact of all their injuries have been to their penalty killing, where they have had no more than two to three of their top six forwards at any given time. Right now that’s just those whose name ends in “Oss” (or “Os”).
Primary Forwards TOI/GP CE/60
Lee Stempniak     1.7    76.2
Blake Comeau      1.2    78.5
Curtis Glencross  2.2    83.8
Tom Kostopoulos   1.4    89.1
Mikael Backlund   1.0    90.5
David Moss        1.4   122.6
The Flames didn’t have to dip into their secondary penalty killers, which actually includes a few players who have successfully played that role in the not-too-distant past (Olli Jokinen and Matt Stajan). I really ought to budget Alex Tanguay up to the first group.
Depth Forwards   TOI/GP CE/60
Mike Cammalleri   0.7    68.9
Blair Jones       0.6    79.7
Alex Tanguay      1.1    84.6
Olli Jokinen      0.5    90.7
Roman Horak       0.2   115.8
Matt Stajan       0.9   118.8
Lance Bouma       0.4   121.9
In Chris Butler’s absence, Mark Giordano has made the most of his heightened penalty killing role. While Bouwmeester and Hannan get their due, outside Calgary Gio’s defensive skills have largely gone unnoticed.
Primary Defense  TOI/GP CE/60
Mark Giordano     2.0    83.7
Scott Hannan      2.6    84.2
Chris Butler      2.2    92.2
Jay Bouwmeester   3.2    92.5
Calgary doesn’t often resort to anyone but their top four when killing penalties, even when one of them is injured – that shows you their lack of confidence (defensively) in Smith, Sarich, Brodie, et al.
Depth Defense    TOI/GP CE/60
Derek Smith       0.4    60.6
Cory Sarich       0.7   100.1
Brett Carson      0.3   109.1
Goaltending (explanation)
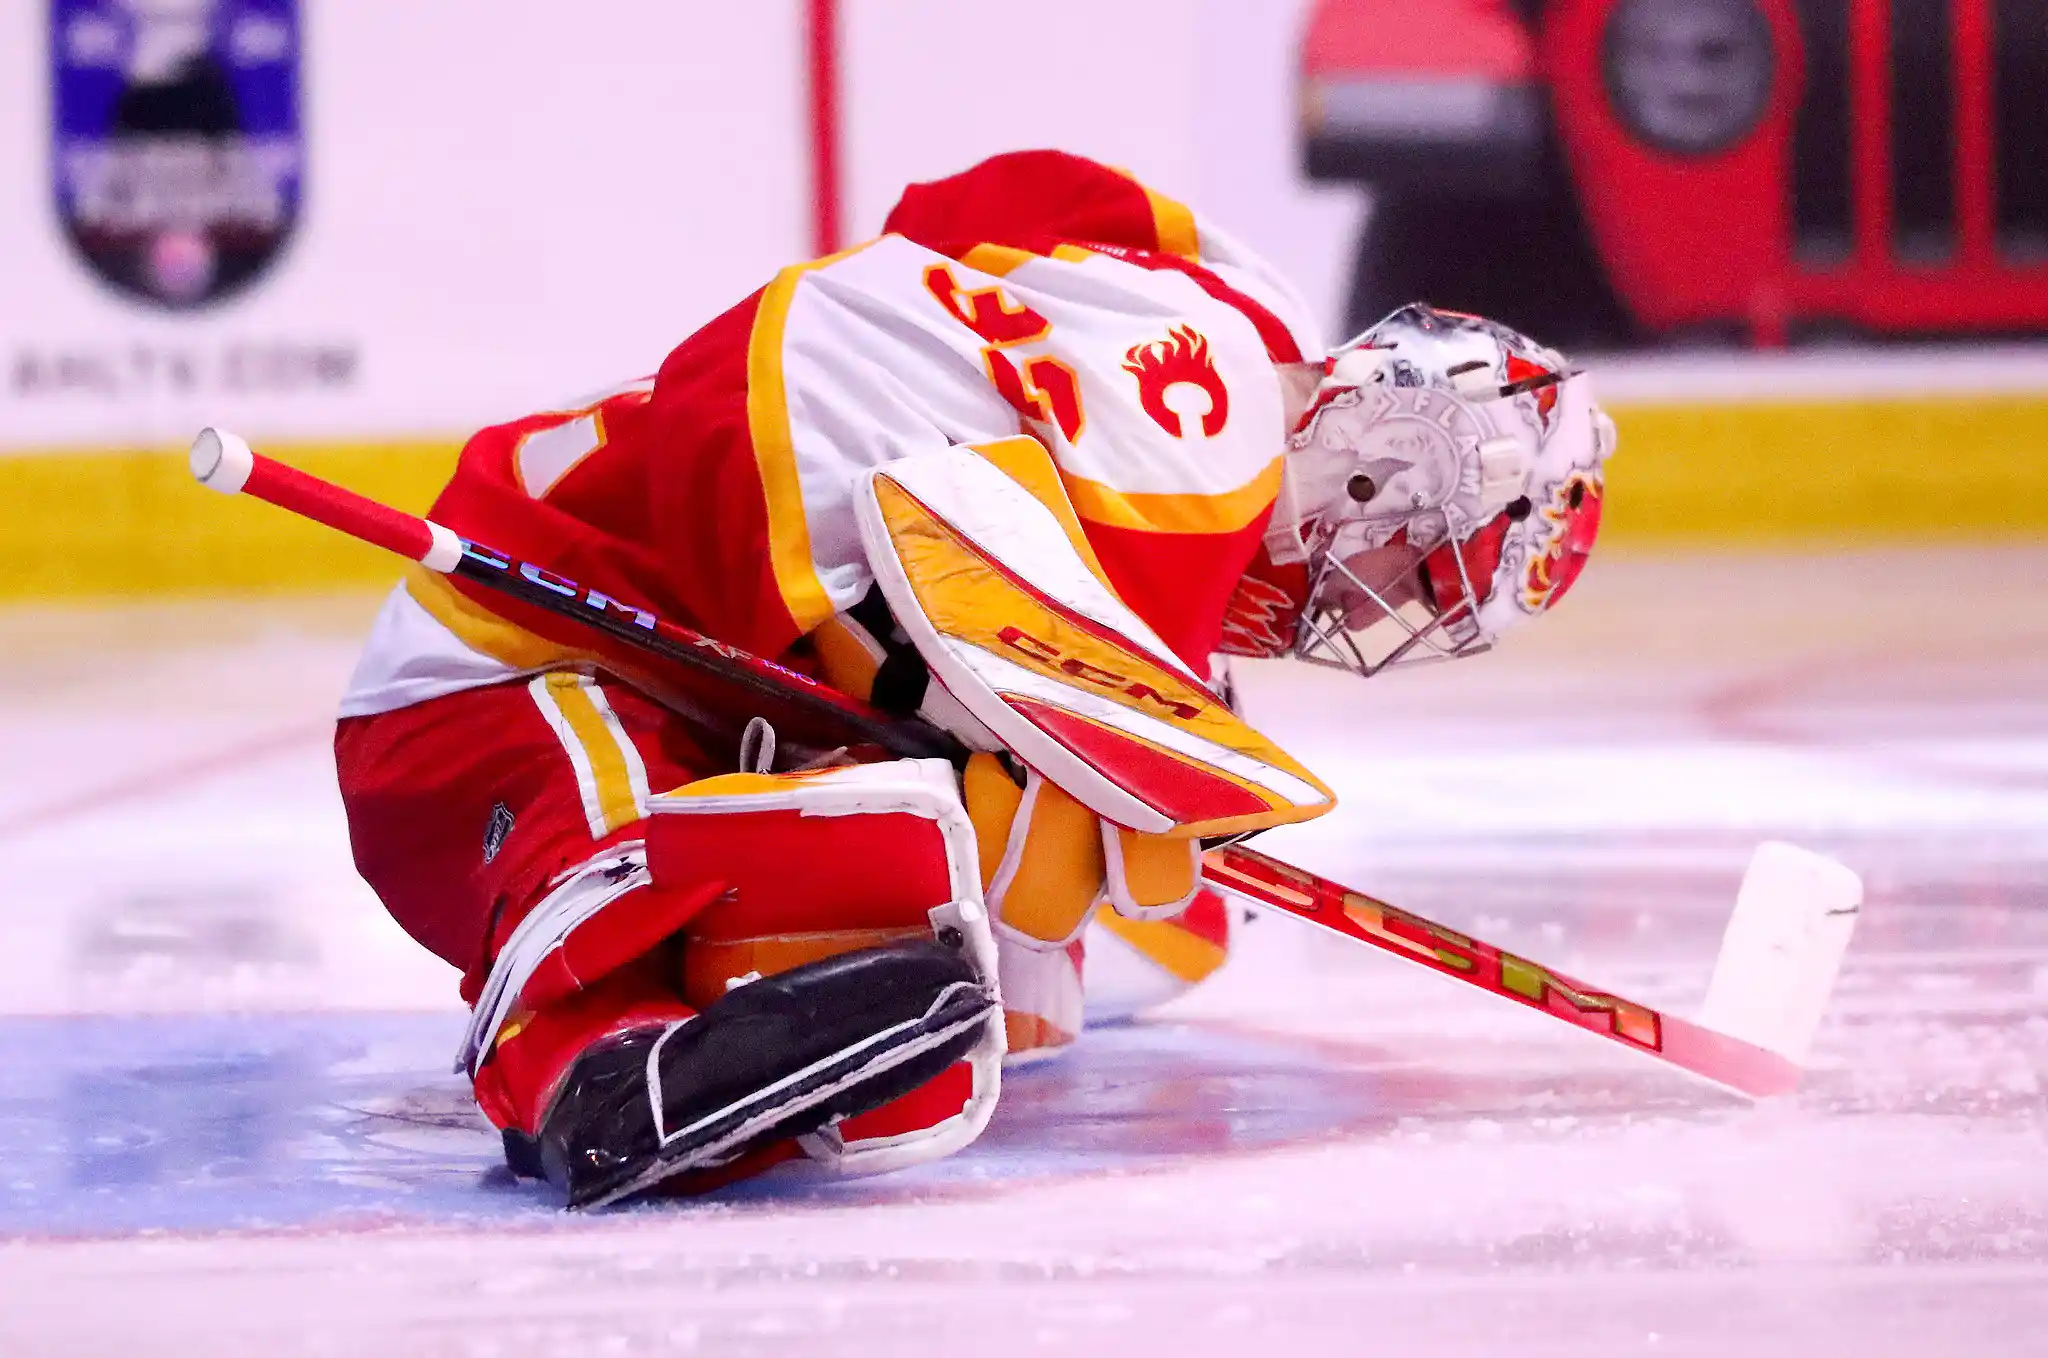
Miikka Kiprusoff earned all three starts this week, earning two Quality Starts in his 40+ shot-facing contests against the Dallas Stars and Winnipeg Jets
Goalie           GS QS   QS%  ESSV%
Miikka Kiprusoff 57 35  61.4%  .929
Leland Irving     6  5  83.3%  .919
Henrik Karlsson   5  1  20.0%  .906
A couple Tuesdays ago I sat behind some Edmonton Oilers fans who had a great time, not just because their team destroyed the Flames, but because they were in a lottery position rather than playing relevant hockey in February (let alone March) like those suckers in Calgary. Now that’s great marketing.
Of course, the odds are 2-to-1 that even a healthy Calgary Flames team makes the post-season, and they’ll never get a big-name, blue-chip player of destiny through the draft, but as hockey fans don’t we like to see 82 games of competitive, NHL-calibre action?
There are 14 games left, including the Minnesota game that will already be in the books by the time you read this, and if the Flames bag 17 points as they have in the past 14 games, they’ll finish with 91 points – their 8th straight season topping 40 wins and 90 points. Only the Detroit Red Wings can beat that. Win or lose, at least we haven’t had to sit through endless putrid hockey as we did from 1997 to 2003.
Recent articles from Robert Vollman