Black Box: Week 27

12 years ago

It’s small comfort, but the Calgary Flames are the best non-playoff team for the third season in a row, save for being a single point behind Dallas in 2010-11. They had a better regulation record than the San Jose Sharks, but unfortunately random skills competitions are part of today’s game and their 5-16 record were one of the many small things that did them in.
The solution is to improve from “bubble team” to “strong team” so that they aren’t relying on the breaks in order to squeeze into the post-season, something they can achieve by gradually shifting their team into a possession-based model, and signing higher-value players.
OZQoC Charts (explanation/last year)
Calgary used 26 forwards this season, one short of the club record. As expected, Jokinen, Tanguay, Iginla, Glencross and Moss all got the tougher assignments just like last year, with the main surprise being that Mikael Backlund’s role changed from more of a sheltered third-liner to those top-six type minutes.
It was thought that Stempniak would continue to play a defensive role like last year, but he was used in a more balanced fashion instead, while Matt Stajan was surprisingly demoted into a depth position over-all. Lance Bouma was essentially promoted from a carefully-sheltered fourth liner to a regular depth forward.
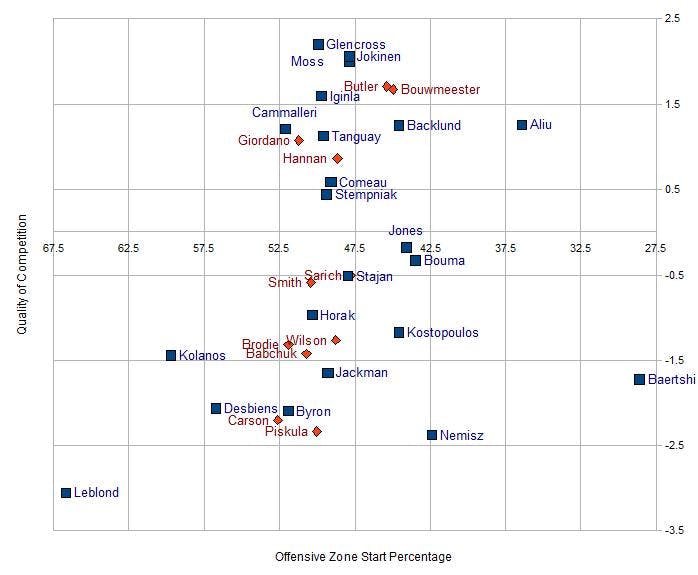
We knew someone was going to play the tough minutes with Jay Bouwmeester this year, who was moved from a more balance role to a far more defensive role, but the only really big surprise this season on defense was that it was Chris Butler instead of Scott Hannan like we expected. The only real significant change in role was Cory Sarich getting an easier assignment against mostly depth-line competition.
Even-Strength Scoring (explanation/last year)
Curtis Glencross and Olli Jokinen scored at the exact same even-strength rate as last season, but saw huge drops in their possession numbers and scoring chance numbers. Interestingly, Jokinen’s goal percentage actually went up, from an almost-team-low of 44.7% to this year’s 47.5%. Drops across the board for Alex Tanguay and Jarome Iginla as well, including their even-strength scoring rate.
Mikael Backlund, who was a sheltered depth forward last year, lost almost half his scoring with his promotion this season, but managed to continue to win the possession and scoring chance battle – too bad the goals simply didn’t follow this year.
Top-Six Forward ESP/60 CEF CEA  CE% SCF SCA SC%   GF   GA    G%
David Moss        1.5   57  50 53.4% 13 16 45.5% 1.79 2.28  44.0%
Mikael Backlund   0.9   53  50 51.6% 16 14 51.7% 1.57 2.92  35.0%
Mike Cammalleri   1.9   50  55 47.4% 17 21 45.7% 2.58 2.84  47.6%
Curtis Glencross  2.1   49  57 46.1% 14 18 43.9% 2.63 3.37  43.8%
Alex Tanguay      2.0   49  58 45.5% 18 17 51.1% 2.85 2.44  53.9%
Olli Jokinen      1.8   48  58 45.3% 15 19 44.4% 2.90 3.20  47.5%
Jarome Iginla     2.1   49  60 44.8% 16 19 46.3% 2.68 2.91  47.9%
Lee Stempniak’s even-strength scoring rate was the same as last year’s in Phoenix, but there was a huge drop for Matt Stajan.
3rd Line Forward ESP/60 CEF CEA  CE% SCF SCA SC%   GF   GA    G%
Lee Stempniak     1.7   54  49 52.3% 16 14 52.5% 2.35 2.50  48.5%
Blake Comeau      0.9   50  50 50.1% 13 15 46.9% 1.29 2.03  38.9%
Matt Stajan       1.3   51  51 49.9% 14 14 50.0% 1.99 2.34  46.0%
Blair Jones       0.9   46  51 47.5% 16 16 50.9% 1.01 1.45  41.1%
Roman Horak       1.1   41  51 44.7% 12 11 51.6% 1.85 1.54  54.6%
Lance Bouma       0.7   42  54 43.7% 12 12 50.0% 0.70 2.10  25.0%
Akim Aliu         8.4   37  51 42.0% 14 14 50.0% 8.42 0.00 100.0%
The biggest drop this season was for Tim Jackman, whose even-strength scoring rate dropped from 1.6 points per 60 minutes to 0.6. He also had his possession percentage drop from 58.3% to 49.9%, scoring chances from 54.3% to 48.0% and of course his scoring percentage from 56.5% to 22.2%. Yowch.
Depth Forward  ESP/60 CEF CEA  CE% SCF SCA SC%   GF   GA    G%
Krys Kolanos     0.5   54  49 52.5% 11 10 53.7% 1.04 1.57  39.8%
Greg Nemisz      0.0   44  43 50.5% 10 11 48.0% 2.61 1.74  60.0%
Tim Jackman      0.6   50  50 49.9% 11 12 48.0% 0.73 2.56  22.2%
Tom Kostopoulos  0.7   50  53 48.3% 12 13 48.3% 1.45 2.55  36.3%
G. Desbiens      0.0   34  45 43.0%  7  7 50.0% 0.00 0.84   0.0%
P-L. Leblond     0.0   46  58 43.9%  8 12 40.0% 4.16 0.00 100.0%
Paul Byron       1.1   35  51 41.1% 11 11 51.3% 1.63 0.54  75.1%
Sven Baertshi    3.5   31  48 38.8% 12 15 43.5% 3.52 1.17  75.1%
Raitis Ivanans   0.0   27  65 29.4%  5 27 16.7% 0.00 5.41   0.0%
Surprisingly, Calgary’s top for defensemen are ranked in the exact same possession percentage order as last year, led by Mark Giordano, who also had the exact same 50.0% goal percentage.
Top-4 Defense  ESP/60 CEF CEA  CE% SCF SCA SC%   GF   GA    G%
Mark Giordano    0.8   49  54 47.6% 14 16 46.7% 2.42 2.42  50.0%
Chris Butler     0.6   49  57 46.0% 16 18 47.3% 2.34 2.53  48.0%
Jay Bouwmeester  0.6   47  56 45.7% 14 17 46.0% 1.89 2.50  43.1%
Scott Hannan     0.5   45  57 44.1% 13 18 42.3% 2.34 2.94  44.3%
Anton Babchuk scored at the exact same rate of 1.1 points per 60 minutes, but saw drops in his percentages across the board. Cory Sarich was one of the few Flames to have his 2011-12 percentages largely match 2010-11, although this is probably a consequence of his significantly reduced role.
Depth Defense  ESP/60 CEF CEA  CE% SCF SCA SC%   GF   GA    G%
Brett Carson     0.0   70  41 63.4% 19 11 63.6% 0.00 5.41   0.0%
Clay Wilson      0.0   49  44 52.9% 14 12 54.2% 1.09 1.09  50.0%
T.J. Brodie      0.6   50  47 51.5% 15 13 53.3% 2.40 2.02  54.3%
Cory Sarich      0.5   49  47 51.0% 13 12 52.8% 1.78 1.78  50.0%
Derek Smith      0.6   49  53 48.1% 15 13 53.5% 2.00 2.27  46.8%
Anton Babchuk    1.1   48  55 46.6% 12 15 44.3% 2.08 1.76  54.2%
Joe Piskula      0.0   50  59 45.9% 19 14 56.7% 0.00 5.54   0.0%
Special teams (explanation/last year)
Olli Jokinen led the team in power play scoring rate once again, increasing from 5.2 to 5.8. His surprise challenger was Curtis Glencross, who scored at the lowly rate of 3.3 last year – although Calgary actually generated far more shots as a team (76.3) with him on the cie last year. In fact, only Lee Stempniak matched last year’s team shooting rate, with Olli Jokinen’s drop being the most significant (93.4 to 81.8).
Primary Forwards    TOI/GP PTS/60 CE/60
Mike Cammalleri      2.9     3.1   91.5
Olli Jokinen         3.0     5.8   81.8
Jarome Iginla        3.3     4.3   81.4
Lee Stempniak        1.8     2.7   81.2
Alex Tanguay         3.1     4.5   81.0
Curtis Glencross     2.1     5.7   70.8
Matt Stajan had his ice-time cut, but had much improved results, while Mikael Backlund continued to be a very usable secondary option. David Moss took a step back from 2010-11’s success.
Secondary Forwards  TOI/GP PTS/60 CE/60
Sven Baertschi       0.6     0.0  104.0
Matt Stajan          0.5     4.2   94.1
Roman Horak          0.5     0.0   85.4
Mikael Backlund      1.1     3.9   85.0
David Moss           0.9     0.0   84.9
Tim Jackman          0.4     0.0   77.2
Blair Jones          0.8     1.8   71.9
Blake Comeau         0.7     0.0   68.8
Krys Kolanos         1.0     0.0   68.4
Mark Giordano’s scoring rate fell from 4.1 to 3.0, and his team shooting rate from 85.6 to 78.9. Jay Bouwmeester’s time was cut from 2.7 minutes per game to 2.2, and his team shooting rate dropped from 84.6 to 80.2, but his personal scoring rate jumped from 2.1 to 3.3.
Defensemen          TOI/GP PTS/60 CE/60
Clay Wilson          1.9     0.0  131.0
Anton Babchuk        2.4     1.6  102.3
Chris Butler         0.7     3.6   81.1
Jay Bouwmeester      2.2     3.3   80.2
Mark Giordano        3.3     3.0   78.9
T.J. Brodie          1.7     3.9   68.0
Derek Smith          1.0     5.1   65.8
Penalty killing
Last year’s top penalty-killing forwards were Curtis Glencross, and the departed Brendan Morrison, followed by Tom Kostopoulos and David Moss. Moss had a tough year, and Kostopoulos continued to struggle, but Tanguay was much improved, Glencross remained strong and their two new arrivals Lee Stempniak and Blake Comeau filled in nicely.
Primary Forwards TOI/GP CE/60
Lee Stempniak     1.4    75.9
Blake Comeau      1.3    78.3
Curtis Glencross  2.1    83.6
Alex Tanguay      1.3    88.7
Tom Kostopoulos   1.5    91.2
David Moss        1.4   103.4
Calgary’s depth options were nothing to get excited about, except perhaps Mike Cammalleri.
Depth Forwards   TOI/GP CE/60
Mike Cammalleri   0.6    68.3
Mikael Backlund   1.0    90.5
Olli Jokinen      0.4    93.4
Blair Jones       0.7    97.1
Matt Stajan       1.0   113.8
Lance Bouma       0.5   119.5
Scott Hannan had a solid year on the PK, and there were big improvements from Jay Bouwmeester and Chris Butler. Unfortunately Mark Giordano’s play returned to average, and Cory Sarich saw his playing time significantly reduced, along with his results.
Defensemen       TOI/GP CE/60
Scott Hannan      2.7    84.9
Mark Giordano     2.1    89.3
Chris Butler      2.2    92.4
Jay Bouwmeester   3.1    92.7
Cory Sarich       0.8    95.1
Goaltending (explanation/last year)
Kiprusoff was 12th in even-strength save percentage (among goalies with 20 games or more), even with Pekka Rinne and ahead of Tim Thomas. You really can’t ask for more than that (without being a bit of a jerk).
Before the season began we mentioned that a Quality Start percentage of 60% is probably all they needed to make the post-season. They wound up at 59.8%.
Goalie           GS QS   QS%  ESSV%
Miikka Kiprusoff 68 42  61.8%  .928
Leland Irving     7  5  71.4%  .911
Henrik Karlsson   7  2  28.6%  .910
It was nice to the end the season with a couple of wins, but that really bad preceding stretch where they had only a single win in nine games, many of them against either basement dwellers or play-off spot rivals, were obviously the games that really mattered.
Recent articles from Robert Vollman