Black Box: Week 5

12 years ago

Five weeks and 13 games into the season and the Flames are playing exactly .500 hockey, just like the Ottawa Senators and Vancouver Canucks. I didn’t expect to ever put that sentence together.
Calgary’s offense has been struggling, managing just 30 goals in 13 games, more than just Detroit, Los Angeles, Anaheim and the Islanders. Wow, another sentence I wasn’t expecting to assemble.
OZQoC Charts (explanation)
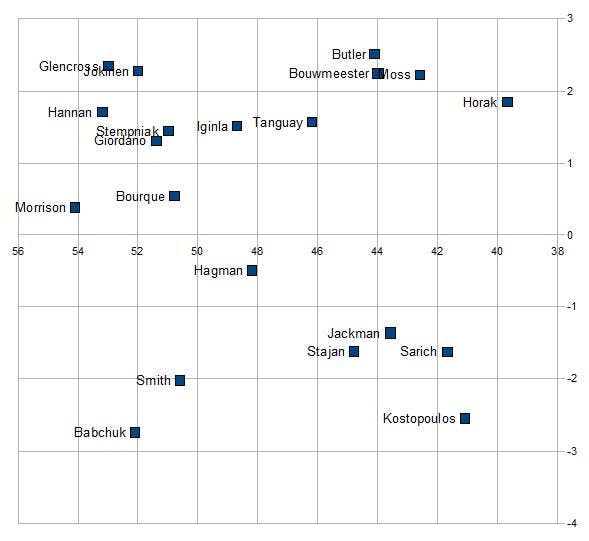
The OZQoC Chart is a graphical representation of how the Flames are using everyone. The players facing the toughest opponents are at the top of the graph, whereas those facing fourth lines are at the bottom. Those starting mostly in their own zone in defensive situations are in the far right, and those starting mostly in the opposing zone in offensive situations are on the far left.
On defense, Chris Butler, Jay Bouwmeester, Scott Hannan and Mark Giordano all play against top opponents, but Butler/Bouwmeester in more defensive situations and Hannan/Giordano in more offensive situations. Cory Sarich is given defensive assignments against depth lines, while Derek Smith and Anton Babchuk are generally sheltered – getting offensive assignments against depth lines.
This is largely what we expected based on last year’s usage, except for two things: Cory Sarich being protected from facing the top lines, and Scott Hannan being used in a more offensive role.
Up front the Curtis Glencross, Olli Jokinen and Lee Stempniak line is playing against top lines, but mostly in offensive situations. Jarome Iginla and Alex Tanguay are playing against top-six opponents, but in more balanced situations, while David Moss and Roman Horak are (surprisingly) being used against top lines in defensive situations.
Brendan Morrison, Rene Bourque and Niklas Hagman are being used in fairly average fashion, with a slight nod towards the offensive spectrum, while Tim Jackman, Matt Stajan and Tom Kostopoulos are being used defensively, but against depth lines only.
The forward usage strays slightly from last year’s usage only in that Lee Stempniak is being used in a somewhat offensive role, and we expected Jokinen and Glencross to play in fewer offensive-minded situations than Iginla and Tanguay. Matt Stajan’s demotion to the fourth line was somewhat expected, but we didn’t expect Moss and Horak to get the real tough defensive ice-time either.
Keep all of this in mind when interpreting the statistics to come.
Even-Strength Scoring (explanation)
Hockey is a team game and rather than look at individual goals and assists, look at how the team does as a whole with certain players on the ice. Disregard the plus/minus statistic, because (based on substantial research) their leaders like Anton Babchuk, Scott Hannan and Roman Horak are actually struggling and their good luck is about to change.
The table below has three sets of percentages, the first one being the most important – the percentage of all on-ice attempted shots (goals, saves, goalposts, missed nets, blocked shots) enjoyed by the Flames rather than their opponents. While a player may find it difficult to control whether a puck is going to pick a corner or get deflected wide, they certainly have a consistent ability to create or prevent those chances, so it’s the most reliable statistic here (once you take their usage into account, discussed in the first section). The next two percentages are for scoring chances and goals, which each involve an increasing proportion of luck.
Player         ESP/60 CEF CEA  CE% SCF SCA SC%   GF   GA    G%
Lee Stempniak    1.8   61  52 53.8% 18 16 53.7% 2.86 2.50  53.4%
Derek Smith      0.0   52  47 52.7%  9 10 48.7% 2.00 1.50  57.1%
Chris Butler     0.5   54  51 51.6% 13 17 44.6% 2.42 2.42  50.0%
Matt Stajan      1.1   53  50 51.3% 12 14 46.9% 2.09 2.62  44.4%
Curtis Glencross 2.2   57  54 51.3% 13 11 53.8% 2.56 3.29  43.8%
Olli Jokinen     1.9   57  55 50.7% 13 13 49.4% 2.57 2.89  47.1%
Jay Bouwmeester  0.5   53  53 50.1% 12 16 42.5% 2.38 1.90  55.6%
Brendan Morrison 0.0   52  53 49.7% 15 16 49.1% 1.17 0.00 100.0%
Tim Jackman      1.1   45  46 49.7%  8 11 42.4% 1.14 2.85  28.6%
David Moss       1.8   51  52 49.6%  9 15 37.5% 1.76 1.76  50.0%
Cory Sarich      0.4   48  51 48.6% 11  9 54.0% 1.18 1.97  37.5%
Niklas Hagman    1.8   46  51 47.5% 11 10 51.4% 2.38 0.00 100.0%
P-L Leblond      0.0   47  52 47.0%  6 12 33.3% 5.82 0.00 100.0%
Jarome Iginla    0.9   50  58 46.6% 12 16 42.3% 1.42 1.42  50.0%
Rene Bourque     1.1   47  54 46.5%  8 14 36.7% 1.82 2.54  41.7%
Mark Giordano    0.6   49  57 46.2% 12 14 47.9% 1.94 1.94  50.0%
Alex Tanguay     2.3   50  60 45.3% 15 16 48.4% 2.67 1.34  66.6%
Tom Kostopoulos  1.6   42  50 45.3% 10 10 51.4% 1.63 1.63  50.0%
Scott Hannan     1.1   45  56 44.2% 11 13 47.1% 2.28 1.71  57.1%
Roman Horak      2.4   37  54 40.5%  9 13 42.6% 2.35 1.41  62.5%
Anton Babchuk    1.5   41  65 38.9%  9 15 37.5% 2.30 0.77  74.9%
Brendan Morrison was finally on ice for an even-strength goal. Along with Niklas Hagman and Pierre-Luc Leblond (in 2 games of extremely limited action), he’s the only Flames yet to be scored against at even-strength. Nevertheless the Flames forward against whom opponents are taking the fewest shots is Tim Jackman – but unfortunately they’ve been converting on those chances to a relatively high degree.
Curtis Glencross had a tough week, coming crashing down to Earth after a solid first month. His line (with Jokinen and Stempniak) remains the most offensively capable, but we were expecting that, based on their usage. Alex Tanguay is actually enjoying a higher scoring rate, but based on how the Flames are being out-shot and out-chanced with him on the ice we have to wonder how much of that is luck.
And don’t be fooled by Roman Horak’s 5 points and +2, or Anton Babchuk’s 3 points and +3 in 7 games, because the team has actually been struggling with them on the ice – although in Horak’s case it’s certainly understandable given his tough ice-time. The Flames are enjoying just 40% of the shots and/or scoring chances with them on the ice, but have been lucky enough to enjoy up to 75% of the scoring – that won’t last.
Special teams (explanation)
Calgary currently stands 14th in the league, converting of 17.8% of power play opportunities, just a little higher than the league average of 17.4% and slightly off last year’s pace of 19.5%.
Player              TOI/GP PTS/60 CE/60
Anton Babchuk        1.4     6.2   98.6
David Moss           1.4     0.0   96.8
Jay Bouwmeester      1.8     5.2   83.2
Chris Butler         0.7     6.5   78.3
Brendan Morrison     1.2     0.0   77.5
Olli Jokinen         2.9     4.8   76.7
Niklas Hagman        1.2     6.4   76.1
Lee Stempniak        1.5     0.0   69.5
Jarome Iginla        3.3     7.1   69.4
Derek Smith          0.8     0.0   62.6
Mark Giordano        3.4     4.1   60.9
Alex Tanguay         3.5     5.3   60.5
Curtis Glencross     1.8     5.4   59.7
Rene Bourque         2.8     3.3   56.7
Roman Horak          0.8     0.0   45.6
Tim Jackman          0.4     0.0   21.6
Just like last year, not a single Flame (not even power play specialist Anton Babchuk) has been on the ice for 100 attempts shots per 60 minutes. Calgary seems to be a team that likes to cycle it around and only take advantage of the high-percentage opportunities, especially their top unit of Jokinen, Iginla, Giordano, Tanguay and Bourque.
Their penalty killing team, by contrast, likes to encourage opponents to take a lot of shots from the outside. The Flames have five players allowed more than 100 attempted shots per 60 minutes last season – Jay Bouwmeester, Tom Kostpooulos, Alex Tanguay, Brendan Mikkelson and Chris Butler. This year Butler is actually one of the four to allow fewer, along with Brendan Morrison and fellow new arrivals Lee Stempniak and Roman Horak.
Player           TOI/GP CE/60
Jay Bouwmeester   2.6   119.4
Mark Giordano     2.4   106.4
Scott Hannan      2.4   116.6
Chris Butler      2.1    98.3
Curtis Glencross  2.0   108.9
Rene Bourque      1.7   101.3
David Moss        1.7   148.3
Lee Stempniak     1.5    98.2
Tom Kostopoulos   1.4   122.7
Brendan Morrison  0.8    84.6
Roman Horak       0.8    98.0
Matt Stajan       0.8   139.8
Cory Sarich       0.6   180.8
It was a tough week for top penalty killers Jay Bouwmeester, Curtis Glencross, and Rene Bourque, who all saw huge increases in attempted shots against, which generally means they’ve had trouble clearing the zone. Over-all the Flames penalty killing is almost dead average, killing off 82.6%, a step up from last year’s 81.2%.
Goaltending (explanation)
The Flames are 10th best in the league in goals against thanks in part to their goalies stopping 92.1% of shots. Miikka Kiprusoff and Henrik Karlsson are on a roll with 5 Quality Starts in their last 6, improving from their initial 2-for-7 to 7-for-13 today. The Flames should generally expect Quality Starts about 60% of the time.
Goalie           GS QS  QS%  ESSV%
Miikka Kiprusoff 10  6 60.0%  .936
Henrik Karlsson   3  1 33.3%  .909
That’s it for week five. Please be generous with your questions and comments, a lot of readers know these stats well, and Kent and I can do our best to answer any questions too.
Recent articles from Robert Vollman