How do Micheal Ferland and Elias Lindholm, Dougie Hamilton and Noah Hanifin compare?
By Ari Yanover
5 years agoYou have to give in order to get. Did the Flames get enough for what they gave up?
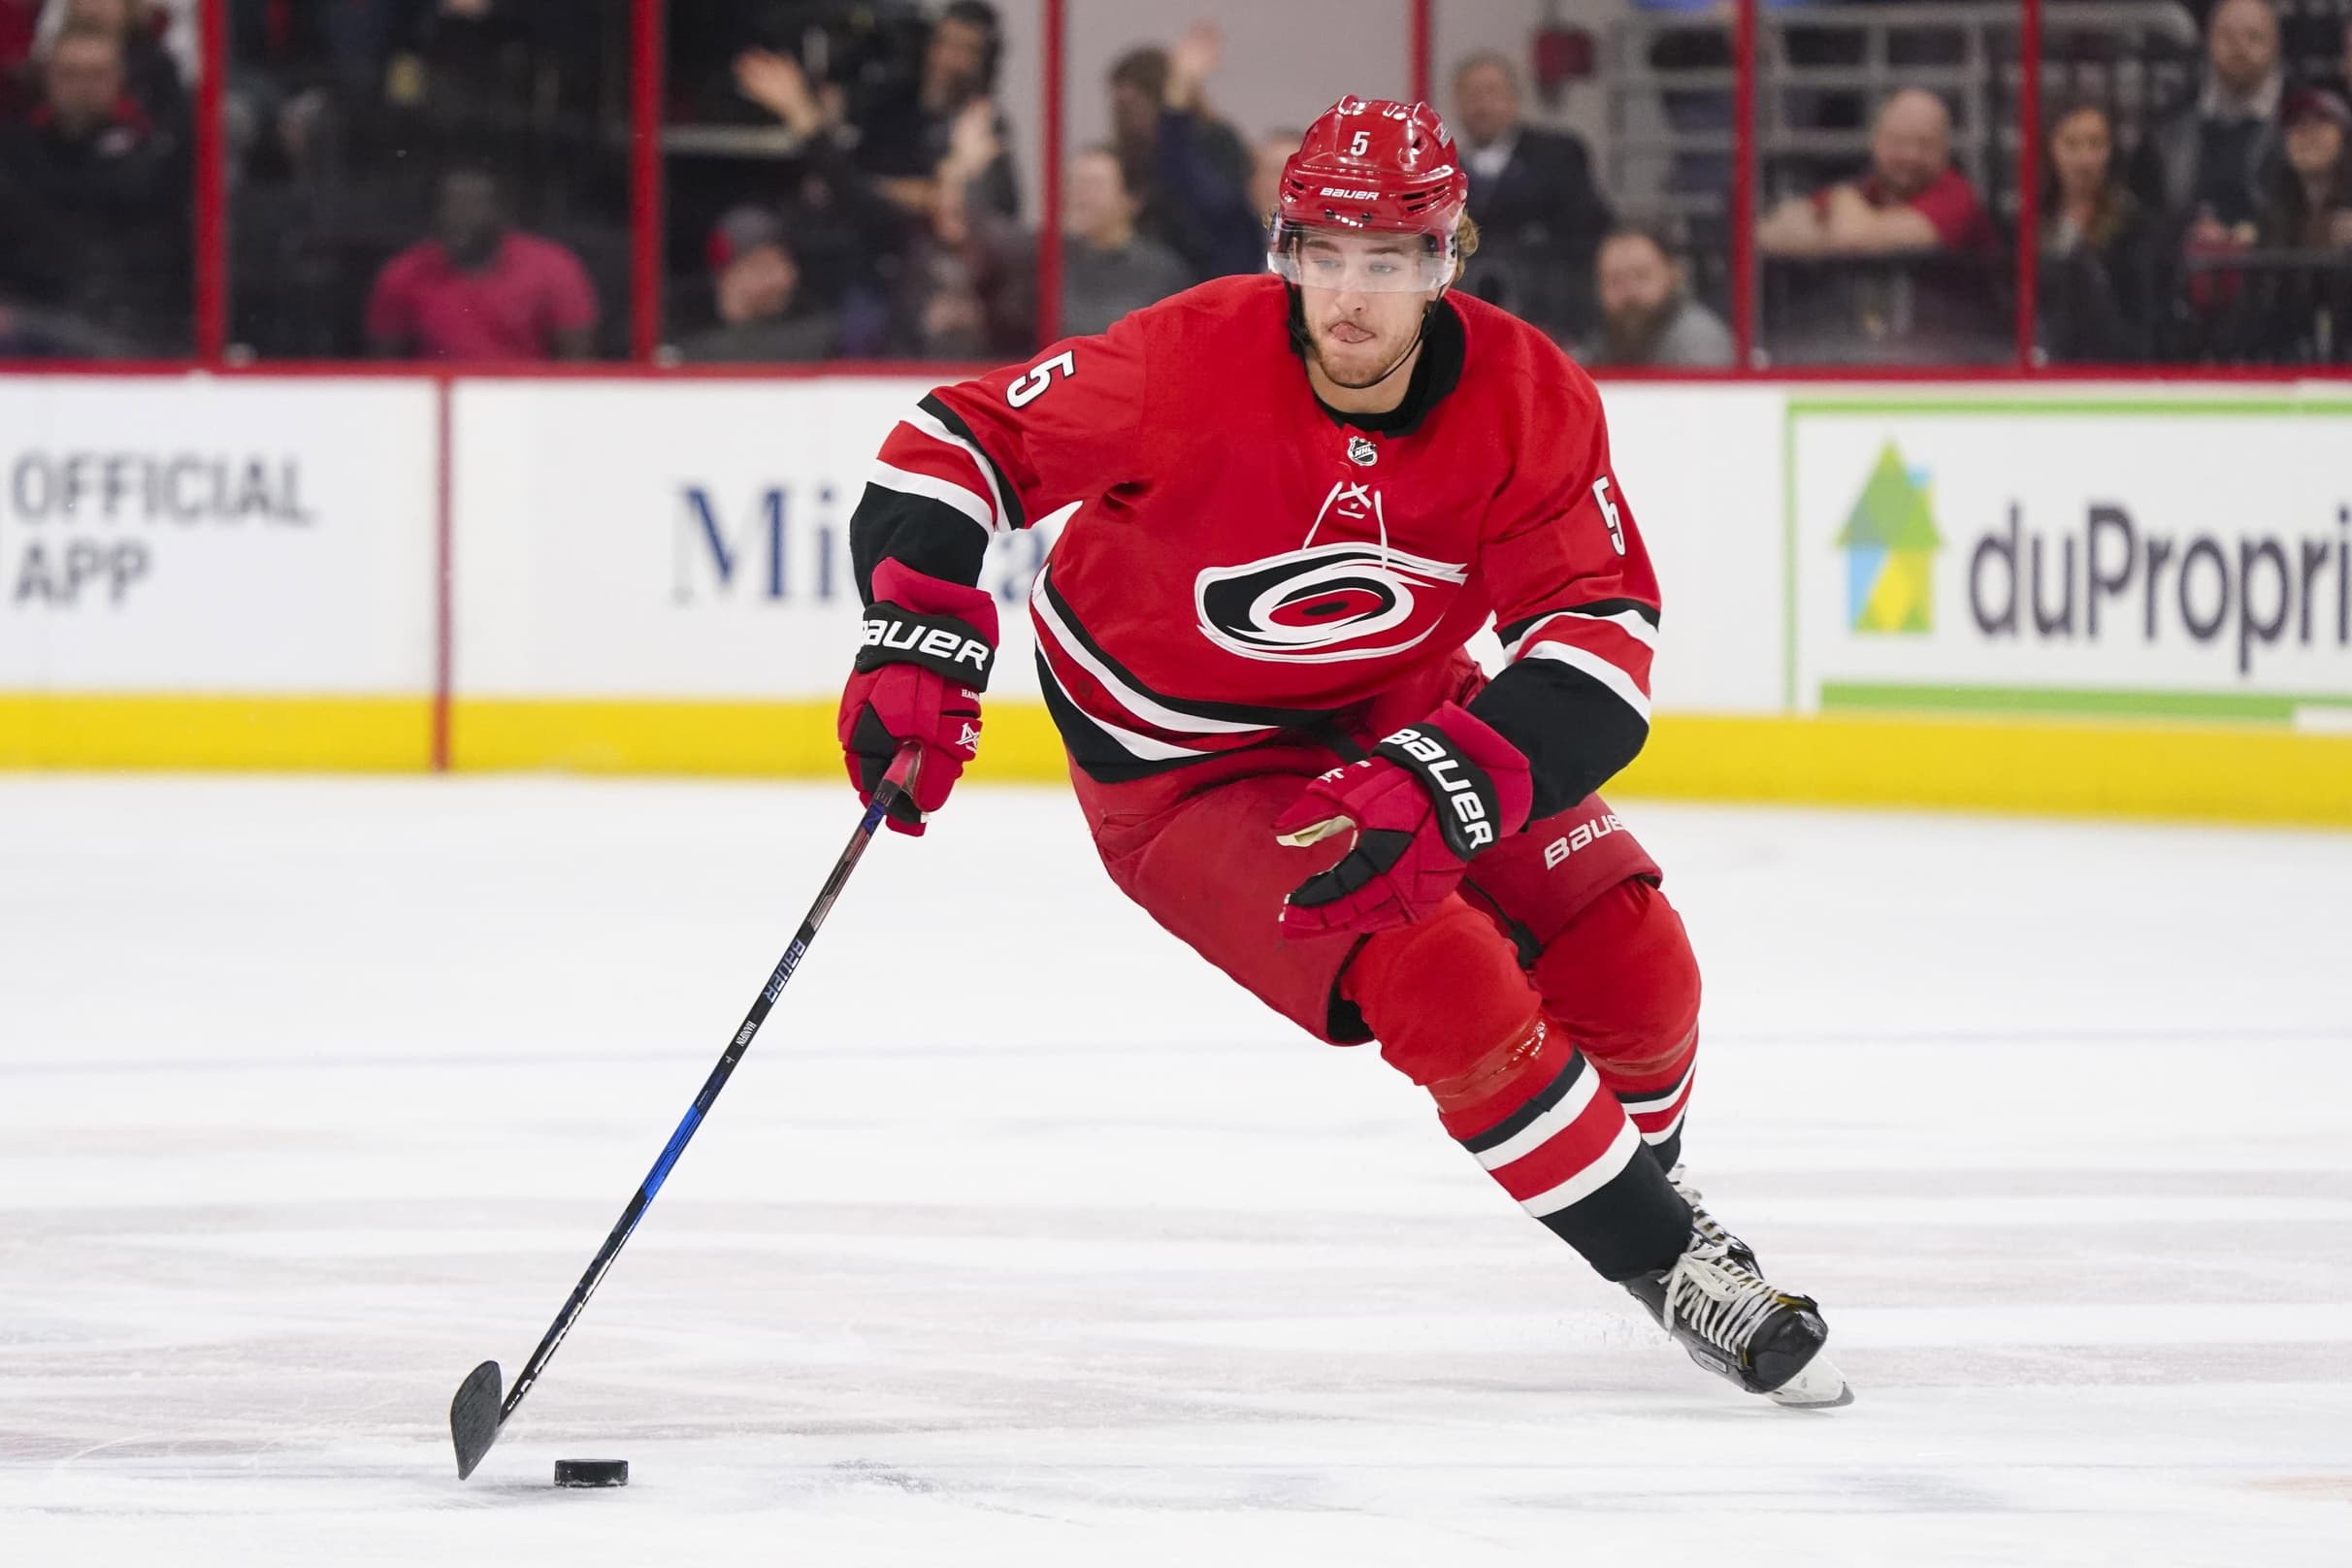
Let’s remove any off-ice speculation and boil the trade down to the cold, hard, indisputable facts: the Flames gave up an NHL forward (Micheal Ferland), an NHL defenceman (Dougie Hamilton), and a prospect who may or may not become an NHLer (Adam Fox) for an NHL forward (Elias Lindholm) and an NHL defenceman (Noah Hanifin).
Fox is a real question mark here, so let’s shuffle him off to the side for now and simply look at forward versus forward, and defenceman versus defenceman.
Ferland vs. Lindholm
Ferland faced a winding road to the NHL. Drafted in the fifth round, his first attempt at going professional found him back in the WHL as an overager. The following season, he started showing great promise in the AHL, scoring 18 points over 25 games before suffering a season-ending knee injury. But ultimately, that didn’t get in his way; by the end of the season after that one, he’d broken out with a ferocious first round playoff series, and firmly cemented his place as an NHLer.
Highly touted, Lindholm had a much more direct path to the NHL. The fifth overall pick of the 2013 NHL draft – taken right before Sean Monahan – he made the NHL right away, and ultimately ended up playing only six games in the AHL. Since his rookie season, he has always been in the top six in team scoring for the Hurricanes.
Ferland was a left-shot left winger who played alongside Johnny Gaudreau and Monahan on the Flames’ top line. Lindholm, a right-shot centre, is expected to fill in the same spot.
Physical stats
| Player | Age | Height | Weight |
| Ferland | 26 | 6’2 | 208 lbs. |
| Lindholm | 23 | 6’1 | 192 lbs. |
The Flames got a younger, but smaller and lighter, forward in the trade.
Standard stats (2017-18 season)
| Player | Games played | Goals | Assists | Points | Shots | Shooting percentage | Average ice time |
| Ferland | 77 | 21 | 20 | 41 | 144 | 14.6 | 15:01 |
| Lindholm | 81 | 16 | 28 | 44 | 153 | 10.5 | 17:54 |
The Flames got a player who puts up more points, and relied less on a high shooting percentage in order to do so. However, Lindholm required more time in order to put up his points: while Ferland scored at a rate of 2.13 points per 60, Lindholm was at 1.82.
| Player | Even strength points | Powerplay points | Shorthanded points |
| Ferland | 35 | 6 | 0 |
| Lindholm | 34 | 9 | 1 |
Both players scored roughly the same amount at even strength. Ferland played 142:42 on the powerplay throughout the season, while Lindholm got 212:16. However, Lindholm has the edge on Ferland when it comes to powerplay scoring: while Ferland scored 2.52 points per 60 on the man advantage, Lindholm scored 2.55.
Standard stats (career)
| Player | Games played | Goals/GP | Assists/GP | Points/GP | Shots/GP | Shooting percentage | Average ice time |
| Ferland | 250 | .168 | .188 | .356 | 1.624 | 10.3 | 12:49 |
| Lindholm | 374 | .171 | .332 | .503 | 1.925 | 8.9 | 17:09 |
Lindholm has consistently been the stronger offensive player, albeit with far more ice time to work with. However, he hasn’t been as reliant on a strong shooting percentage in order to score: Ferland shot at over 14% the past two seasons in order to score 25 and then 41 points, while Lindholm’s career high of 12.9 – set in his rookie season – doesn’t quite touch that, and neither does his next highest shooting percentage of 10.5. He has also scored over 40 points the past two seasons, and hit 39 the two seasons before that. In other words: Lindholm is probably the more reliable scorer.
Underlying stats (2017-18 season)
| Player | 5v5 CF% | 5v5 CF% rel | 5v5 HDCF% | 5v5 HDCF% rel | OZS% | PDO |
| Ferland | 51.93 | -1.99 | 53.32 | -2.76 | 56.10 | 1.016 |
| Lindholm | 53.25 | -1.76 | 50.62 | -2.70 | 56.93 | .974 |
While both players were sheltered in terms of zone starts, Lindholm was, ultimately, the better player in terms of underlying numbers – but only just barely (which could correlate with his slightly better offensive zone starts). However, Ferland’s PDO suggested he got luckier than Lindholm did. Lindholm has consistently had a sub-1.000 PDO throughout his career, while Ferland has hovered just about 1.000 in three of his four NHL seasons.
Also worth noting? Ferland has been a negative 5v5 CF% rel player the past two seasons, but was a positive relative player in 2015-16. Meanwhile, before this season, Lindholm was a positive CF% rel player for three seasons: including a +2.96 in 2015-16.
However, this past season was the only year in which Ferland really received sheltered minutes (a byproduct of him making it to the first line), whereas save for a 50.23 OZS% in 2016-17, Lindholm has always been a sheltered player.
Ultimately, Ferland has probably had the luckier career in recent seasons, but Lindholm has consistently been put in a position to succeed, while Ferland has not.
Hamilton vs. Hanifin
Hamilton and Hanifin had very similar career paths to the NHL: both were highly touted first rounders who stepped in immediately. Hamilton came up from the OHL, while Hanifin entered from the NCAA.
Physical stats
| Player | Age | Height | Weight |
| Hamilton | 25 | 6’6 | 210 lbs. |
| Hanifin | 21 | 6’3 | 206 lbs. |
The Flames got a younger defenceman, and didn’t really sacrifice much in the way of size.
Standard stats (2017-18 season)
| Player | Games played | Goals | Assists | Points | Shots | Shooting percentage | Average ice time |
| Hamilton | 82 | 17 | 27 | 44 | 270 | 6.3 | 21:32 |
| Hanifin | 79 | 10 | 22 | 32 | 165 | 6.1 | 18:52 |
It might be a problem when the defenceman just dealt away scored as many points as the new forward who is supposed to fix the top line.
Hamilton is the higher-scoring defenceman, not to mention a shooting machine: Brent Burns is the only defenceman who took more shots on net than he did. He did have more ice time with which to shoot, but an extra 2:30 per game doesn’t exactly explain an extra 105 shots on net: Hamilton had 9.18 shots per 60, while Hanifin was at 6.64.
| Player | Even strength points | Powerplay points | Shorthanded points |
| Hamilton | 32 | 12 | 0 |
| Hanifin | 25 | 7 | 0 |
Hanifin was a little less reliant on the powerplay than Hamilton was: roughly 78% of his offence came at even strength, while for Hamilton, it was roughly 73%. Hamilton also had substantially more powerplay time: he played 218:15 on the man advantage, while Hanifin played 142:04.
Standard stats (career)
| Player | Games played | Goals/GP | Assists/GP | Points/GP | Shots/GP | Shooting percentage | Average ice time |
| Hamilton | 423 | .151 | .369 | .520 | 2.522 | 6.0 | 20:00 |
| Hanifin | 239 | .075 | .272 | .347 | 1.653 | 4.6 | 18:14 |
Hamilton is, flat out, the superior offensive player. He doesn’t rely on extra ice time to score, nor an inflated shooting percentage. There’s every reason to believe he can continue to put up 40+ points a season on a regular basis, as he has done the past four seasons.
However, Hanifin is younger, and Hamilton has had longer to develop his craft. So, could Hanifin develop into a high-end scorer?
In Hamilton’s first season, he scored 1.33 points per 60; Hanifin scored 0.93. In year two, the gap closed: Hamilton scored 1.23 points per 60, and Hanifin scored 1.20. However, they separated again in year three, and not for the better: Hamilton scored 1.64 points per 60, while Hanifin scored 1.29. Hamilton has not dropped below 1.50 points per 60 since his sophomore year, while Hanifin has yet to reach that marker.
Underlying stats (2017-18 season)
| Player | 5v5 CF% | 5v5 CF% rel | 5v5 HDCF% | 5v5 HDCF% rel | OZS% | PDO |
| Hamilton | 57.63 | +6.65 | 60.07 | +8.01 | 53.00 | 0.987 |
| Hanifin | 56.19 | +2.53 | 55.02 | +3.56 | 62.79 | 0.969 |
Here’s where there is, perhaps, reason for concern. While scoring points isn’t the be all, end all for a defender – their main job is to defend, after all – underlying numbers tend to provide a more accurate look at a player’s defensive abilities. While Hanifin isn’t bad by any means, Hamilton’s numbers are hilariously above and beyond his, and that’s while being a significantly less sheltered player.
However, how much of an influence did Mark Giordano have on Hamilton’s stellar numbers? Honestly, probably not much: together they were a 58.25% 5v5 CF duo. Apart, both were at 53.33%. They made each other better players, but didn’t suffer all that much when separated from one another.
Hanifin’s defence partner in 2017-18 was Trevor van Riemsdyk, who is notably not as good of a player as Giordano. Together, they were a 55.71% 5v5 CF duo. Separated, Hanifin’s numbers were a little above van Riemsdyk’s – 56.75% compared to 55.16% – which hints he could potentially put together a better season with a better partner, but probably isn’t on Hamilton’s level.
Hamilton has always been a positive 5v5 CF% rel player. Hanifin only reached that level this past season; in his first two seasons, he was in the negatives. And Hanifin’s least-sheltered year – a 54.94% offensive zone start ratio in his rookie season – is more sheltered than Hamilton has ever been. Hanifin is younger, so there is hope he can develop into something more, and might even score more with more powerplay time. But if he’s expected to play second pairing minutes alongside Travis Hamonic while TJ Brodie presumably reunites with Giordano, then the Flames still downgraded at the position.
Fox vs. Nobody
And then there’s the part wherein the Flames gave up an extra asset, even though it appears they gave up by far the best player in the trade in Hamilton.
There are other factors to take into account – willingness to sign, cap space, whatever there is off the ice – but purely from an on-the-ice glance, it looks like the Flames overpaid to ultimately downgrade their roster: they probably got a little better at the forward position, but ended up worse off on the blueline, and threw in a highly touted prospect for good measure.
They did get younger, which could conceivably extend their contention window, but it’s not as though they were ancient to begin with.
ARTICLE BROUGHT TO YOU BY SPORTS EXCELLENCE

Founded in 1950, Sports Excellence Corporation represents over 150 family-owned independent hockey retailers across Canada and the United States. Our highly knowledgeable hockey specialists are available to assist all your equipment needs. Find your closest Sports Excellence retailer here: Find a location near you!
Recent articles from Ari Yanover

