Mid-Year Update on the Oilers

By RexLibris
8 years agoI don’t know that many teams going into the 2015-2015 had as
mixed expectations as the Oilers, simultaneously predicted to do great things
with Connor McDavid and be terrible because, well, they have been for such a
very long time.
mixed expectations as the Oilers, simultaneously predicted to do great things
with Connor McDavid and be terrible because, well, they have been for such a
very long time.
So how have things gone for this enigmatic organization thus
far? Well, not surprisingly, both bad and good, albeit relatively speaking.
far? Well, not surprisingly, both bad and good, albeit relatively speaking.
Again, we are revisiting the three Pacific Division teams we
first examined at the beginning of the season: the Canucks, Oilers and Flames.
first examined at the beginning of the season: the Canucks, Oilers and Flames.
Previously we looked in on the Canucks’ season to see how
things were progressing.
things were progressing.
Today we look at the Oilers.
The Oilers’ record as of January 7th was 17-21-3
for 37 pts and they sat 7th in the Pacific and 14th in the Western Conference.
for 37 pts and they sat 7th in the Pacific and 14th in the Western Conference.
First, let’s look at the individual player stats to see how
they are faring relative to expectations.
they are faring relative to expectations.

(all data courtesy of NHL.com and affiliated sites)
The supporting cast are nowhere near meeting expectations
but the core group and skill players are either meeting or exceeding those and
some by a wide margin as the Oilers have three 1.00 or greater ppg players and
another five at >.5 ppg.
but the core group and skill players are either meeting or exceeding those and
some by a wide margin as the Oilers have three 1.00 or greater ppg players and
another five at >.5 ppg.
Leon Draisaitl has had a tremendous season thus far,
exceeding virtually all expectations. Hall is on pace to record his first full
(or nearly full, knock on wood) season and is proving himself as a bona fide
star to many outside of the Edmonton market. Brandon Davidson has been a
revelation – many others have said the exact same thing but it is appropriate
enough for me to repeat it here without risk of plagiarism.
Hard decisions were made with regards to Nikita Nikitin, Ben
Scrivens, Mark Fayne and former captain Andrew Ference. These may seem obvious
moves to those outside Edmonton, but for fans of the team it is a new day when
players are evaluated strictly according to their on-ice performance.
Scrivens, Mark Fayne and former captain Andrew Ference. These may seem obvious
moves to those outside Edmonton, but for fans of the team it is a new day when
players are evaluated strictly according to their on-ice performance.
What these moves portend on the roster pales in comparison with what they may result in with regards to evaluating those in management who advocated for the above players. If two years of Nikita Nikitin results in Peter Chiarelli ignoring advice from Scott Howson for the foreseeable future, then it will have been $9 million dollars (yes, that’s right) well spent. Okay, $9 million not entirely wasted. Better?
The same issues have arisen this year that have plagued the
team going back nearly a decade: defense and injuries. I’ll touch on the former
here and the latter further on.
team going back nearly a decade: defense and injuries. I’ll touch on the former
here and the latter further on.
The Oilers receive some of the lowest point
production totals in the league from their defense. This means that the
forwards are responsible for nearly all of the offense. If we were to use an 80/20
forward -to-defense breakdown of production, which is probably a conservative amount for most teams around
the league, then the Oilers are 2%
below that line right now. By contrast the Flames are currently getting 32% of
their production from the blueline (the Canucks are sitting at 23%, for
interest’s sake).
It isn’t just the standard shot-from-the-point stuff on the
powerplay, either, but also the breakout pass, the headman pass, the zone exit and
all those small things that help to move the puck to the attacker in good
position that the Oilers are lacking.
powerplay, either, but also the breakout pass, the headman pass, the zone exit and
all those small things that help to move the puck to the attacker in good
position that the Oilers are lacking.
So while Hall, Draisaitl, Purcell, Nugent-Hopkins and Eberle
are producing the offense for the team they are also having to provide that
offense through an extra 30 to 50 feet of ice and opposition.
are producing the offense for the team they are also having to provide that
offense through an extra 30 to 50 feet of ice and opposition.
The team’s record is a sufficient indicator of the likelihood
of success using that model.
of success using that model.
My bold prediction? That until the Oilers can add
two top pairing defensemen they will continue to struggle yet the difficulty
comes in acquiring those players without losing what offensive talents they
have. I bet that is the first time anyone has offered that bit of cunning
analysis.
two top pairing defensemen they will continue to struggle yet the difficulty
comes in acquiring those players without losing what offensive talents they
have. I bet that is the first time anyone has offered that bit of cunning
analysis.
The Numbers

(Data courtesy of War on Ice)
The Oilers are losing ground on the puck possession battle.
They had been holding or improving up until the injury to Klefbom and fans of
the Flames will recognize what the loss of a good defender can do to a team’s
puck possession numbers, so I suspect that this will improve with Klefbom’s
return. The period between the two Pittsburgh games marks the point where
the team began to post better shot differential numbers more consistently.
Coincidentally enough, the team sv% dipped at that same point as Nilsson was
somewhat inconsistent during that period.
Shortly after the halfway mark of the season the Oilers
dropped several more games to fall even further behind in the Pacific division
at the same time that it was announced that Klefbom would be out until after
the All-Star game with a staph infection in his leg. Those two things have more
or less signaled the end of the Oilers’ playoff hopes for this season.
After 41 games the Oilers PP sat at 25th with
16.7% and the PK at 15th with 80.5%. A penalty kill is a necessity
for a young team as it allows them to make mistakes and still recover. The
powerplay, given the skill available and Todd McLellan’s reputation in this area,
is overdue to improve and will likely do so as…wait for it…some of the key
players return from injury.
Crop Circles + Voodoo = Goalies


(All data courtesy of NHL.com and affiliated sites)
After years of below-average to catastrophic goaltending
the Oilers are beginning to get some better performances, initially from Anders
Nilsson and more recently from the player that was touted as the potential
starter, Cam Talbot. The average listed here is league average (0.916 at the time of writing) and shows that Nilsson has established himself as a capable backup while Talbot appears to be working himself towards league-average.
The goal differential appears to be trending in a positive
way, although the graph shows that this team has had periods where they have
been quite unpredictable from game-to-game. With most of these measures there
are two ways to look at them. Either relative to the league, whereby the
Oilers’ current spot in the standings is entirely justified, or relative to
their past seasons whereby one is inclined to say that progress is being made.
One is pessimistic the other optimistic, both are true insofar as they are
validated by the perception of the observer.
The way the roster is built in the immediate and short-term it
would seem that outscoring their mistakes will be the principle strategy until
the defense begins to round into form. That being said, the Oilers have shown
more recently that they are beginning to challenge teams in close games,
holding narrow leads or maintaining an even score for extended periods without
having to rely solely on extraordinary goaltending.
None of that will matter unless they can do it consistently
and learn to defend a lead, though again the return of several key players from
injury over the next month should help in that matter.
and learn to defend a lead, though again the return of several key players from
injury over the next month should help in that matter.
It should be noted that the improvements made by the team
from mid-November through December occurred with all three forwards from their
2nd line on injured reserve for extended periods in Nail Yakupov, Connor McDavid, and Benoit
Pouliot.
from mid-November through December occurred with all three forwards from their
2nd line on injured reserve for extended periods in Nail Yakupov, Connor McDavid, and Benoit
Pouliot.
Story of the Season So Far?
(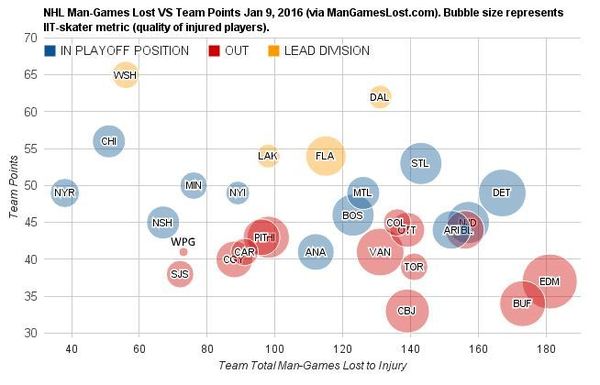

(Data courtesy of Man Games Lost)
Injuries.
The Oilers lead the league in man games lost to injury as
well as the impact of those players lost.
well as the impact of those players lost.
Injuries are not an excuse, but they
are an explanation.
are an explanation.
The Oilers simply do not have the depth or established
level of play yet to absorb this kind of loss without it having an impact on
the team’s results. Arguably no team in the league could lose their 1st
pairing defender and their entire 2nd line without showing some
signs of struggle. The difficulty for the Oilers is that their margin for error
was already far too narrow.
Man Games Lost is a terrific website which tracks the number
of man-games lost by a team within a season as well as their relative position
within the league. The site operator also includes a new metric called Impact
Injury which seeks to quantify the quality of the player lost by way of
CorsiRel, or the possession impact that player has for that team.
of man-games lost by a team within a season as well as their relative position
within the league. The site operator also includes a new metric called Impact
Injury which seeks to quantify the quality of the player lost by way of
CorsiRel, or the possession impact that player has for that team.
For example,
if the Flames were to lose both TJ Brodie and Deryk Engelland for a month,
rather than equate those two roster losses as being on par, the IIT metric
measures that the loss of Brodie is far more likely to have a performance
impact on the team than the loss of Engelland.
if the Flames were to lose both TJ Brodie and Deryk Engelland for a month,
rather than equate those two roster losses as being on par, the IIT metric
measures that the loss of Brodie is far more likely to have a performance
impact on the team than the loss of Engelland.
Thus the IIT metric shows the
impact of injuries by way of man-games lost and the significance of those
injuries for the team.
impact of injuries by way of man-games lost and the significance of those
injuries for the team.
After 41 games, Edmonton, Detroit and Buffalo led the league
in the number of man-games lost and all have significant losses by the IIT
metric with Edmonton having placed all of Eberle, McDavid, Pouliot, Klefbom and
Yakupov on injured reserve for extended periods of time at some point this
season. Only Detroit, with it’s established roster and strong farm team, has so far been able to weather that storm.
The Man Games Lost site will be moving to a less regular update schedule
this month so the data provided here may not be entirely up-to-date in the
months to come, but nevertheless the picture provided is fairly clear. The
Oilers have overcome significant injuries this season and have maintained a
reasonable pace longer than in seasons past.
this month so the data provided here may not be entirely up-to-date in the
months to come, but nevertheless the picture provided is fairly clear. The
Oilers have overcome significant injuries this season and have maintained a
reasonable pace longer than in seasons past.
How Will It End?

(Courtesy of MicahBlakeMcCurdy@Inneffectivemath)
My initial estimate for the Oilers’ was they would finish
with 93 points but be outside the playoff picture.
with 93 points but be outside the playoff picture.
This was based on Rob
Vollman’s luck-neutral point projection that attempts to remove the unknown
elements that emerge mid-season.
Vollman’s luck-neutral point projection that attempts to remove the unknown
elements that emerge mid-season.
Micah Blake McCurdy at Ineffective Math uses a
running projection system based on current performance to estimate points and
has the Oilers well shy of that with a dismal 78 points as of January 11th.
running projection system based on current performance to estimate points and
has the Oilers well shy of that with a dismal 78 points as of January 11th.
Any attempt to measure progress for this team this year will
be have to focus on elements in addition to the standings such as improvement
of rookie performances, establishment of veteran core players, systems play and
some inkling of establishing a starting goaltender for next season.
be have to focus on elements in addition to the standings such as improvement
of rookie performances, establishment of veteran core players, systems play and
some inkling of establishing a starting goaltender for next season.
We’ll revisit all three teams at the end of the regular
season to see how estimates compare to the final results.
season to see how estimates compare to the final results.
For now it appears that the Oilers are staring at another
lost season by way of the standings. Whether that was ever a realistic
expectation is up for debate but it needs to be noted that it was never forecast here.
lost season by way of the standings. Whether that was ever a realistic
expectation is up for debate but it needs to be noted that it was never forecast here.
The Oilers are currently in the mix of being one of the bottom
three teams in the league alongside Columbus and Buffalo. Their most recent
chances of drafting in the top three are 32.2%, according to DTM About Heart@DTMAboutHeart(as of Jan 13th).
three teams in the league alongside Columbus and Buffalo. Their most recent
chances of drafting in the top three are 32.2%, according to DTM About Heart@DTMAboutHeart(as of Jan 13th).
So if you thought the league had a bug up its butt last year
when the Oilers picked McDavid, wait and see what happens at this year’s draft
lottery. If they pick 1st or even 2nd we’ll likely hear
about rule changes before Bill Daly can even finish announcing the draft order.
when the Oilers picked McDavid, wait and see what happens at this year’s draft
lottery. If they pick 1st or even 2nd we’ll likely hear
about rule changes before Bill Daly can even finish announcing the draft order.
The Song
I’d chosen Johnny Cash as a musical herald for this team at
the beginning of the year. I didn’t expect that the hard-luck, man-in-black
theme would become so appropriate. The Oilers started the season with a broken
roster, a bad schedule, a new coach and system, and many more questions than
answers. But at least it was a team a fan could cheer for. It was just over a
dozen games into the season before hearts were broken and then the New Year ushered
in that same old sinking feeling.
So why this song you ask? Here’s why.
San Quentin, you’ve
been livin’ hell to me
You’ve hosted me since nineteen sixty three
I’ve seen ’em come and go and I’ve seen them die
And long ago I stopped askin’ why
been livin’ hell to me
You’ve hosted me since nineteen sixty three
I’ve seen ’em come and go and I’ve seen them die
And long ago I stopped askin’ why
San Quentin, I hate every inch of you.
You’ve cut me and have scarred me thru an’ thru.
And I’ll walk out a wiser weaker man;
Mister Congressman why can’t you understand.
You’ve cut me and have scarred me thru an’ thru.
And I’ll walk out a wiser weaker man;
Mister Congressman why can’t you understand.
Recent articles from RexLibris