The New Jets: Team Overview
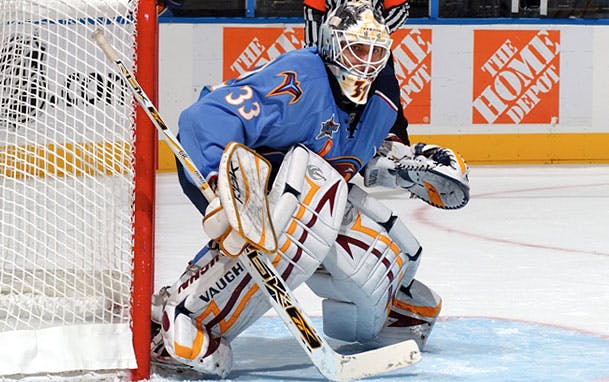
(Robert is a Winnipeg resident and a Jets fan in a past life. He will be covering the as-of-yet-unnamed club for us going forward, particularly when Jets Nation inevitably springs to life. This post is the first in a series looking at the erstwhile Thrashers to see what the seventh Canadian team was like last year)
Lost in all the hoopla surrounding the relocation of a NHL team to my town is that at some point this fall, they actually have to play hockey against other teams, and that the Thrashers weren’t anything particularly special at that activity last year. In the first of a series of articles, I’ll examine the the team’s performance in the collective.
Atlanta had a terrific start to the year, posting a 19-11-5 record by December 20th. That was a period where the Thrashers were piling up big scoring totals and a few misguided souls were unironically discussing Dustin Byfuglien as a Norris Trophy candidate. Reality set in as the season progressed, and they finished the year 15-25-7 to fall out of the playoff race in the East, completing the year with 80 points.
As regular readers may know by now, I’m inclined to use outshooting numbers when the game is tied to examine performance, so that score effects are eliminated, and that I find it instructive to note when a team seems to have an abnormally high on ice SH or SV percentage. Outshooting appears to be more reliably repeatable than getting every bounce, in other words. With that stipulated, here are the Atlanta team EV-tied numbers from timeonice.com for the full year. SH= shots, M = misses, BL = blocked shots:
| GF | GA | SH F | SH A | SH % | M F | M A | Fenwick% | BL A | BL F | Corsi% | EVSV% | EVSH% |
|---|---|---|---|---|---|---|---|---|---|---|---|---|
| 59 | 58 | 863 | 860 | 0.501 | 294 | 304 | 0.498 | 367 | 434 | 0.488 | 0.933 | 6.8% |
Pretty meh, really. The Thrashers had a good EVSV%, a slightly below average EVSH%, and ended roughly where they belonged in terms of EV outscoring when the game was tied, given a PDO of 100.1. Nothing special, to be certain.
As I noted above, the Thrashers got off to an excellent, and unexpected, start record-wise through the first 35 games of the year. When a team goes off in an unexpected manner, it’s usually wise to see if the underlying numbers support that performance, and the 10/11 Thrashers certainly rate that sort of scrutiny. The following table displays Atlanta’s team outshooting numbers at EV when the game was tied though the first 35 games of the season.
| GF | GA | SH F | SH A | SH % | M F | M A | Fenwick% | BL A | BL F | Corsi% | EVSV% | EVSH% |
|---|---|---|---|---|---|---|---|---|---|---|---|---|
| 27 | 19 | 333 | 364 | 0.478 | 107 | 120 | 0.476 | 146 | 175 | 0.471 | 0.948 | 8.1% |
Those numbers, outside of the goals for/against, aren’t good at all. Not quite Avalanche 09/10 bad, but bad never the less. The Thrashers were being outshot when the score effects weren’t at play by a healthy margin. It’s also fairly clear that the good outscoring numbers were pretty much all Ondrej Pavelec, since shooting 8% as a team isn’t anything too outrageous. As we saw with Colorado last season and Dallas this year, there’s only so long that sort of good fortune will carry forward. What was odd about Atlanta’s year was what happened next:
| GF | GA | SH F | SH A | SH % | M F | M A | Fenwick% | BL A | BL F | Corsi% | EVSV% | EVSH% |
|---|---|---|---|---|---|---|---|---|---|---|---|---|
| 32 | 39 | 498 | 457 | 0.517 | 187 | 184 | 0.513 | 221 | 259 | 0.500 | 0.921 | 6.0% |
The last 45 games saw a marked improvement in the underlying numbers, and the team’s Fenwick-tied during that period was better by a fair margin (.513-.504) than the current Eastern Conference representative in the Finals. The goaltending returned to earth in a big way, and the team shooting percentage took a healthy cut as well. The team PDO at EV-tied went from 102.9 to 98.1, which will kill any team unless they outshoot like the Blackhawks, and so it was with Atlanta. Unlike the 09/10 Avs or the 10/11 Stars, Atlanta actually did play better hockey from late Decmber onwards with not much to show for it, but in the main, the two parts of the season ended with the Thrashers getting about what they deserved at EV.
I also wanted to look at the special teams numbers with regard to shooting data. Atlanta was very productive on the PP early on, with a PP % north of 20 through mid-season. Like their performance at EV, the PP dried up in the second half. Still, the team’s percentage was 12th best in the league for the year at 18.3. The PK was bad from the get-go, and finished 4th from the bottom with a kill rate of 77.5%. As always, the question was; did the underlying numbers rate that sort of performance. All data in this case is from Behind The Net:
| PP shots/60 | PP SH% | PK shots/60 | PK SV% |
|---|---|---|---|
| 49.4 | 12.40% | 52.5 | 0.849 |
The PP numbers aren’t that bad, with the shots/60 ranking 14th and the SH% ranking 11th best league-wide. There’s nothing that sets off any alarm bells, in other words. The PK numbers aren’t good at all, with the shots/60 number being 10th worst, and the PKSV% finishing 3rd from bottom.
That said, given Pavelec’s solid showing at EV, the PKSV% might just be one ot those anomolies that pop up. Special teams SH and SV percentages are even more volatile than those at EV due to the smaller sample size, and although there isn’t much evidence of a team effect on a goalie’s SV%, it should be noted that Chris Boersma’s site does show Atlanta as giving up the highest quality of shots against on the PK in the entire NHL.
Summing up, last year’s Thrasher squad was average at EV, decent on the PP and cover-your-eyes bad on the PK. Given the overall youth of the team’s principal figures, a certain degree of erratic play had to be expected, and barring a major injection of veteran talent this summer, that sort of performance will likely be on display this coming winter as well. Absent Mark Chipman spending a few of the dollars he extracted yesterday afternoon from his smitten fan base, Winnipeg’s best hope for improvement in 11/12 will be if the younger players like Kane and Bogosian make the leap. In the next installment, we’ll begin to examine the new Jets on an individual basis.
Recent articles from Robert Cleave

