
Nation Sites
The Nation Network
FlamesNation has no direct affiliation to the Calgary Flames, Calgary Sports and Entertainment, NHL, or NHLPA
Reviewing Flames Player Projections


Apr 11, 2012, 18:26 EDTUpdated: Apr 11, 2012, 17:53 EDT
You see lots of player projections before the season begins, but how often do we take a look back to check their accuracy? While it takes guts to put your theories and predictions out there, it takes even more guts (or perhaps foolishness) to re-visit them after the fact.
Fortunately our confidence is bolstered by last season when, on the whole, the projections were pretty close (depending who you ask). We’re genuinely as curious as you are as to whether we did better or worse this year. After all, if objective statistical analysis isn’t useful in helping predict future outcomes, how useful is it over-all?
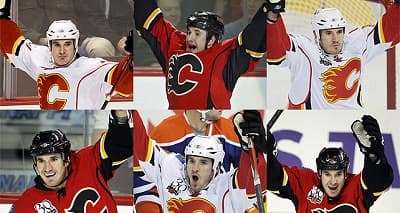
Let’s begin with Calgary’s top six-forwards as they were seen at the start of the season: Jarome Iginla, Alex Tanguay, Olli Jokinen, Curtis Glencross, Lee Stempniak and Rene Bouque.
Jarome Iginla may have defied our projection last year, but this year we caught him practically bang on. Remember that VUKOTA is Tom Awad’s famous projection system (which also projects games played) but tends to be more optimistic than our Snepsts system.
The Snepsts system searches history for players with similar era-adjusted statistics and spits out the average next season’s result for those players, as well as the worst-case and best-case scenario.
System    GP  G  A PTS
VUKOTA    75 32 37  69
Worst     82 19 26  45
Best      82 37 51  88
Average   82 30 38  68
Actual    82 32 35  67
As we expected, Jarome Iginla continues to skate in the tracks of Sergei Fedorov, whose numbers match Iginla’s with eerie accuracy four years in a row now. Unfortunately Fedorov was locked out the next season, and completed his career with several seasons as a 40-point guy.
Alex Tanguay was another guy who embarrassed us last year, but we were closer this year, and even wrote that he would be “likely ending the season in a quest for 50” points. At least we got that right.
System    GP  G  A PTS
VUKOTA    69 15 33  48
Worst     79  8 23  31
Best      79 19 46  65
Average   79 13 32  45
Actual    64 13 36  49
In fairness his rate of scoring was a lot higher than we expected, but in our defense his on-again, off-again injuries – he reportedly couldn’t even raise the puck the last stretch of the season – understandably makes it very difficult to project statistically. When he’s healthy he’s at the upper end of projections and when he isn’t, he can sometimes be near the bottom, like he was in Tampa Bay.
Last year Alex Tanguay may have beaten the expected points-per-game of his historical comparables, but the more optimistic VUKOTA system really nailed his production. Right now his scoring is roughly comparable to Henri Richard’s, near the upper end of expected scoring levels.
Last year’s projection nailed Olli Jokinen within a single point, but the fine-looking Finn blasted the projection this year, finishing just four points shy of the high-water estimate set by Ulf Dahlen.
System    GP  G  A PTS
VUKOTA    68 17 30  47
Worst     82 13 24  37
Best      82 29 36  65
Average   82 17 29  46
Actual    82 23 38  61
In our defense, we identified three players who Jokinen matched most closely: Kelly Kisio, Shawn McEachern and Joe Carveth, the middle of which scored an era-adjusted 18 goals and 59 points in 82 games – almost bang on with Jokinen. Indeed, part of our job is to look at the players spit out by the cold, analytical mind of the Snepsts System and decide who really is the most appropriate match.
Unfortunately McEachern was locked out the following season, and then managed just 8 points in 28 games playing part-time for a very bad Bruins team. Moral of the story: No long-term contracts for Jokinen, please!
Despite being in full agreement with the optimistic VUKOTA engine, we underestimated Curtis Glencross yet again. We had him pegged to finish south of 20 goals and just barely 40 points, and he instead finished 2nd to Iginla with 26 goals, which boosted him up to 48 points – and in 4 fewer games.
System    GP  G  A PTS
VUKOTA    71 19 21  40
Worst     71 10 18  28
Best      71 22 38  60
Average   71 17 23  40
Actual    67 26 22  48
At least his assists were bang on, and in fairness his goal-scoring was boosted by his ridiculous 23.6% shooting percentage. Had it been 16.1% like last year he would have finished with 18 goals, we’d have been bang on, and I’m sure there would consequently have been a line-up of ladies wanting to be with us.
The extra goal scoring left Glencross closer to the best-case scenario than to the average, not too far back from Nik Antropov, who followed this up with two more very strong seasons.
The statistical projection for Lee Stempniak once again came in a little high, but only by a single goal and assist – stretched out over 82 games he was on pace for 19 goals and 19 assists for 38 points. This is also one case where the VUKOTA system was poorly served by its optimistic nature.
System    GP  G  A PTS
VUKOTA    69 19 20  39
Worst     82  6  9  15
Best      82 41 25  66
Average   82 20 20  40
Actual    61 14 14  28
Having missed just 11 games in the past 5 seasons, it was a bit of a surprise to see Stempniak miss 21 as a Flame.
His scoring was ultimately best matched with his closest historical comparable Mark Parrish, who had an era-adjusted 16 goals and 30 points in 66 games in 2007-08. Unfortunately that would be Parrish’s last full season, and he scored just 15 points in 62 games for three teams the rest of his career.
We nailed Rene Bourque last year, projecting his scoring within 2 points. This year … not so much.
System    GP  G  A PTS
VUKOTA    72 24 26  50
Worst     72 18  7  25
Best      72 37 38  75
Average   72 23 26  49
Actual    76 18  6  24
Wow that’s a miss. Almost dead on with the worst-case scenario, an almost irrelevant 1930s-era winger named Nick Wasnie, who was grinding out his last part-season with the awful St. Louis Eagles – who would have guessed he’d be Bourque’s comparable? Other than Chris Chelios perhaps, who played against them both.
Players like Pat Verbeek and Bill Guerin suggested that Bourque had a powerful upside this year (and maybe he did) but instead he did worse than we possibly could have projected. The less we speak of this, the better.
Next Time
As a group we expected an average of 20 goals and 28 assists in 78 games for these folks, and they got 21 goals and 25 assists in 72 games.
System    GP  G  A PTS
Average   78 20 28  48
Actual    72 21 25  46
Individually we got Jarome Iginla, also Lee Stempniak if you adjust for games played and Curtis Glencross if his shooting percentage is a fluke, but lowballed Olli Jokinen and Alex Tanguay (by scoring rate), and blew it with Rene Bourque.
Let’s see if we can do it better next week, when we look at Calgary’s defensemen before we wrap it up later this month with a look at their other forwards.
Recent articles from Robert Vollman
Breaking News
- Scotia Place: a street-level look at construction progress from Stampede Week 2026
- What will the Flames’ power play look like in 2026-27?
- Why Flames prospect Simon Katolicky could be the 2026 draft’s hidden gem
- FN AHL Report Cards: Connor Murphy brought consistency and composure when called upon
- FlamesNation Mailbag: Settling into the dog days of summer

Calgary FlamesTeam Cap Summary

Cap Summary
2026-27
2027-28
Projected Cap Hit
$89,116,666
$70,041,666
Projected Cap Space
$14,883,334
$43,458,334
Current Cap Space
$14,883,334
$43,458,334
Active Players
23/23
16/23
Draft Picks
Round
'26
'27
1
2
1
2
3
2
3
1
2