
Advanced Stats Crash Course: Possession (Part 1)

By Kent Wilson
10 years ago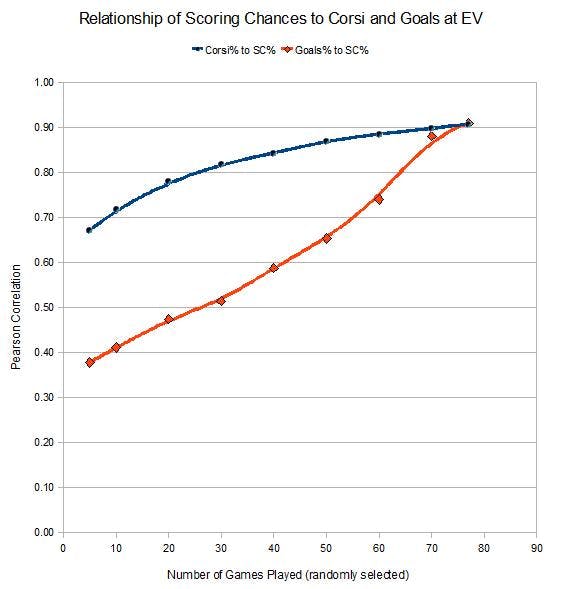
Although "new stats" are still considered the useless obsession of a small collection of dilettantes in some quarters, they are nevertheless growing in prominence and use across the game. Possession stats like corsi are the basis of this upheaval and I still get a lot of questions and requests for clarification when it comes to these sorts of metrics.
Instead of answer them individually via email I decided to put together a crash course of the most important measures. In this series, I’ll discuss what the measures are, what they mean, why they are useful and how they can easily referenced.
We’ll start with corsi.
What is it?
Corsi is named after Buffalo Sabres goalie coach Jim Corsi. It refers to all the shots directed on net (including blocked and missed shots). He created it as way to judge goalie performance.
In 2007, Vic Ferrari (Hockey’s version of Bill James) heard Corsi describe the measure during a radio interview and applied the measure, expressed as a differential (all shots for and against), to the Edmonton Oilers in this seminal article.
From there, corsi was adopted as a proxy for offensive zone puck possession at even strength (5on5 mostly). Later, when individuals started to count scoring chances, it was found that corsi strongly correlated to chance differential over time. Ferrari sums up the key initial insights in that final link:
Bottom Line: Players that drive possession at EV drive results at EV. Maybe not the next game the Oilers play, or the next dozen, but eventually. It’s unstoppable, ability trumps luck eventually, you just have to be patient.
…
Corsi begets scoring chances, scoring chances beget goals, and even over the course of a full season the hockey gods have a huge say in a player’s scoring (and outscoring) results, and a big say in the same results for the team.
And while corsi may not be a perfect measure of territorial advantage, it’s still terrific, moreso than any of us thought, I’m sure.
You can make a good estimate of a player’s scoring chance numbers by using his corsi. And I suspect that the difference is largely luck, scoring chances drifts toward the highly repeatable corsi.
Summary: corsi is all shots directed at the net for and against at even strength. It can be applied at the team level or individual skater level. Corsi stats are a proxy of offensive zone puck possession, meaning a high ratio or differential means a player or team is spending more time in the offensive zone. Conversely, a low ratio or negative differential means a team or player spends more time in the defensive zone.
Studies have shown that corsi highly correlates with scoring chance differential at even strength.
Why are Possession Stats Useful?
In simple terms, corsi stats tell you who is spending more or less time in the offensive zone. That also tends to tell you who has a good or bad scoring chance differential. Over time, outshooting (ie; good possession) correlates with outscoring.
In math terms, counting all of the shots on net gives possession stats more statistical "power" because they wash out a lot of randomness.
Most conventional analysis is goal based, which is superficially rational since scoring and preventing goals is the point of the game. The problem is, goals are relatively rare and relatively random events in hockey games, which makes them rather poor indicators of talent in small samples (a season or less). Not because goals aren’t important, but because of their rarity you need a lot of goals to separate the statistical noise (randomness) from the signal (talent).
There are 10-15 times more shots directed at the net in any given game than there are goals scored. Only about 8% of shots on net at 5on5 actually end up as goals and only about 15% of high quality shots (scoring chances) light the lamp.
To put it another way, there is much, much larger sample of shots than there is of goals at any given time, whether at a team or individual level. Goals are much more subject to swings due to randomness alone as a result. Possession rates, in contrast, are far more stable because the sample size is larger. Once corrected for moderating variables (quality of teammates, ice time and competition), corsi tends to be far more stable than other, more conventional player and team measures. Meaning it is repeatable ie; representative of talent.
Summary: possession measures are more powerful because the number of shots vs goals is vastly larger. They are more stable across players and teams, particularly when certain factors are considered. They correlate with scoring chances and goal rates over time. They are therefore predictive of future success.
Practical Applications
Understanding that corsi = possession = chance differential is a huge step forward in analyzing and predicting outcomes in the NHL. Here is an excellent visual representation of the importance of possession and success in the NHL by Chris Boyle:
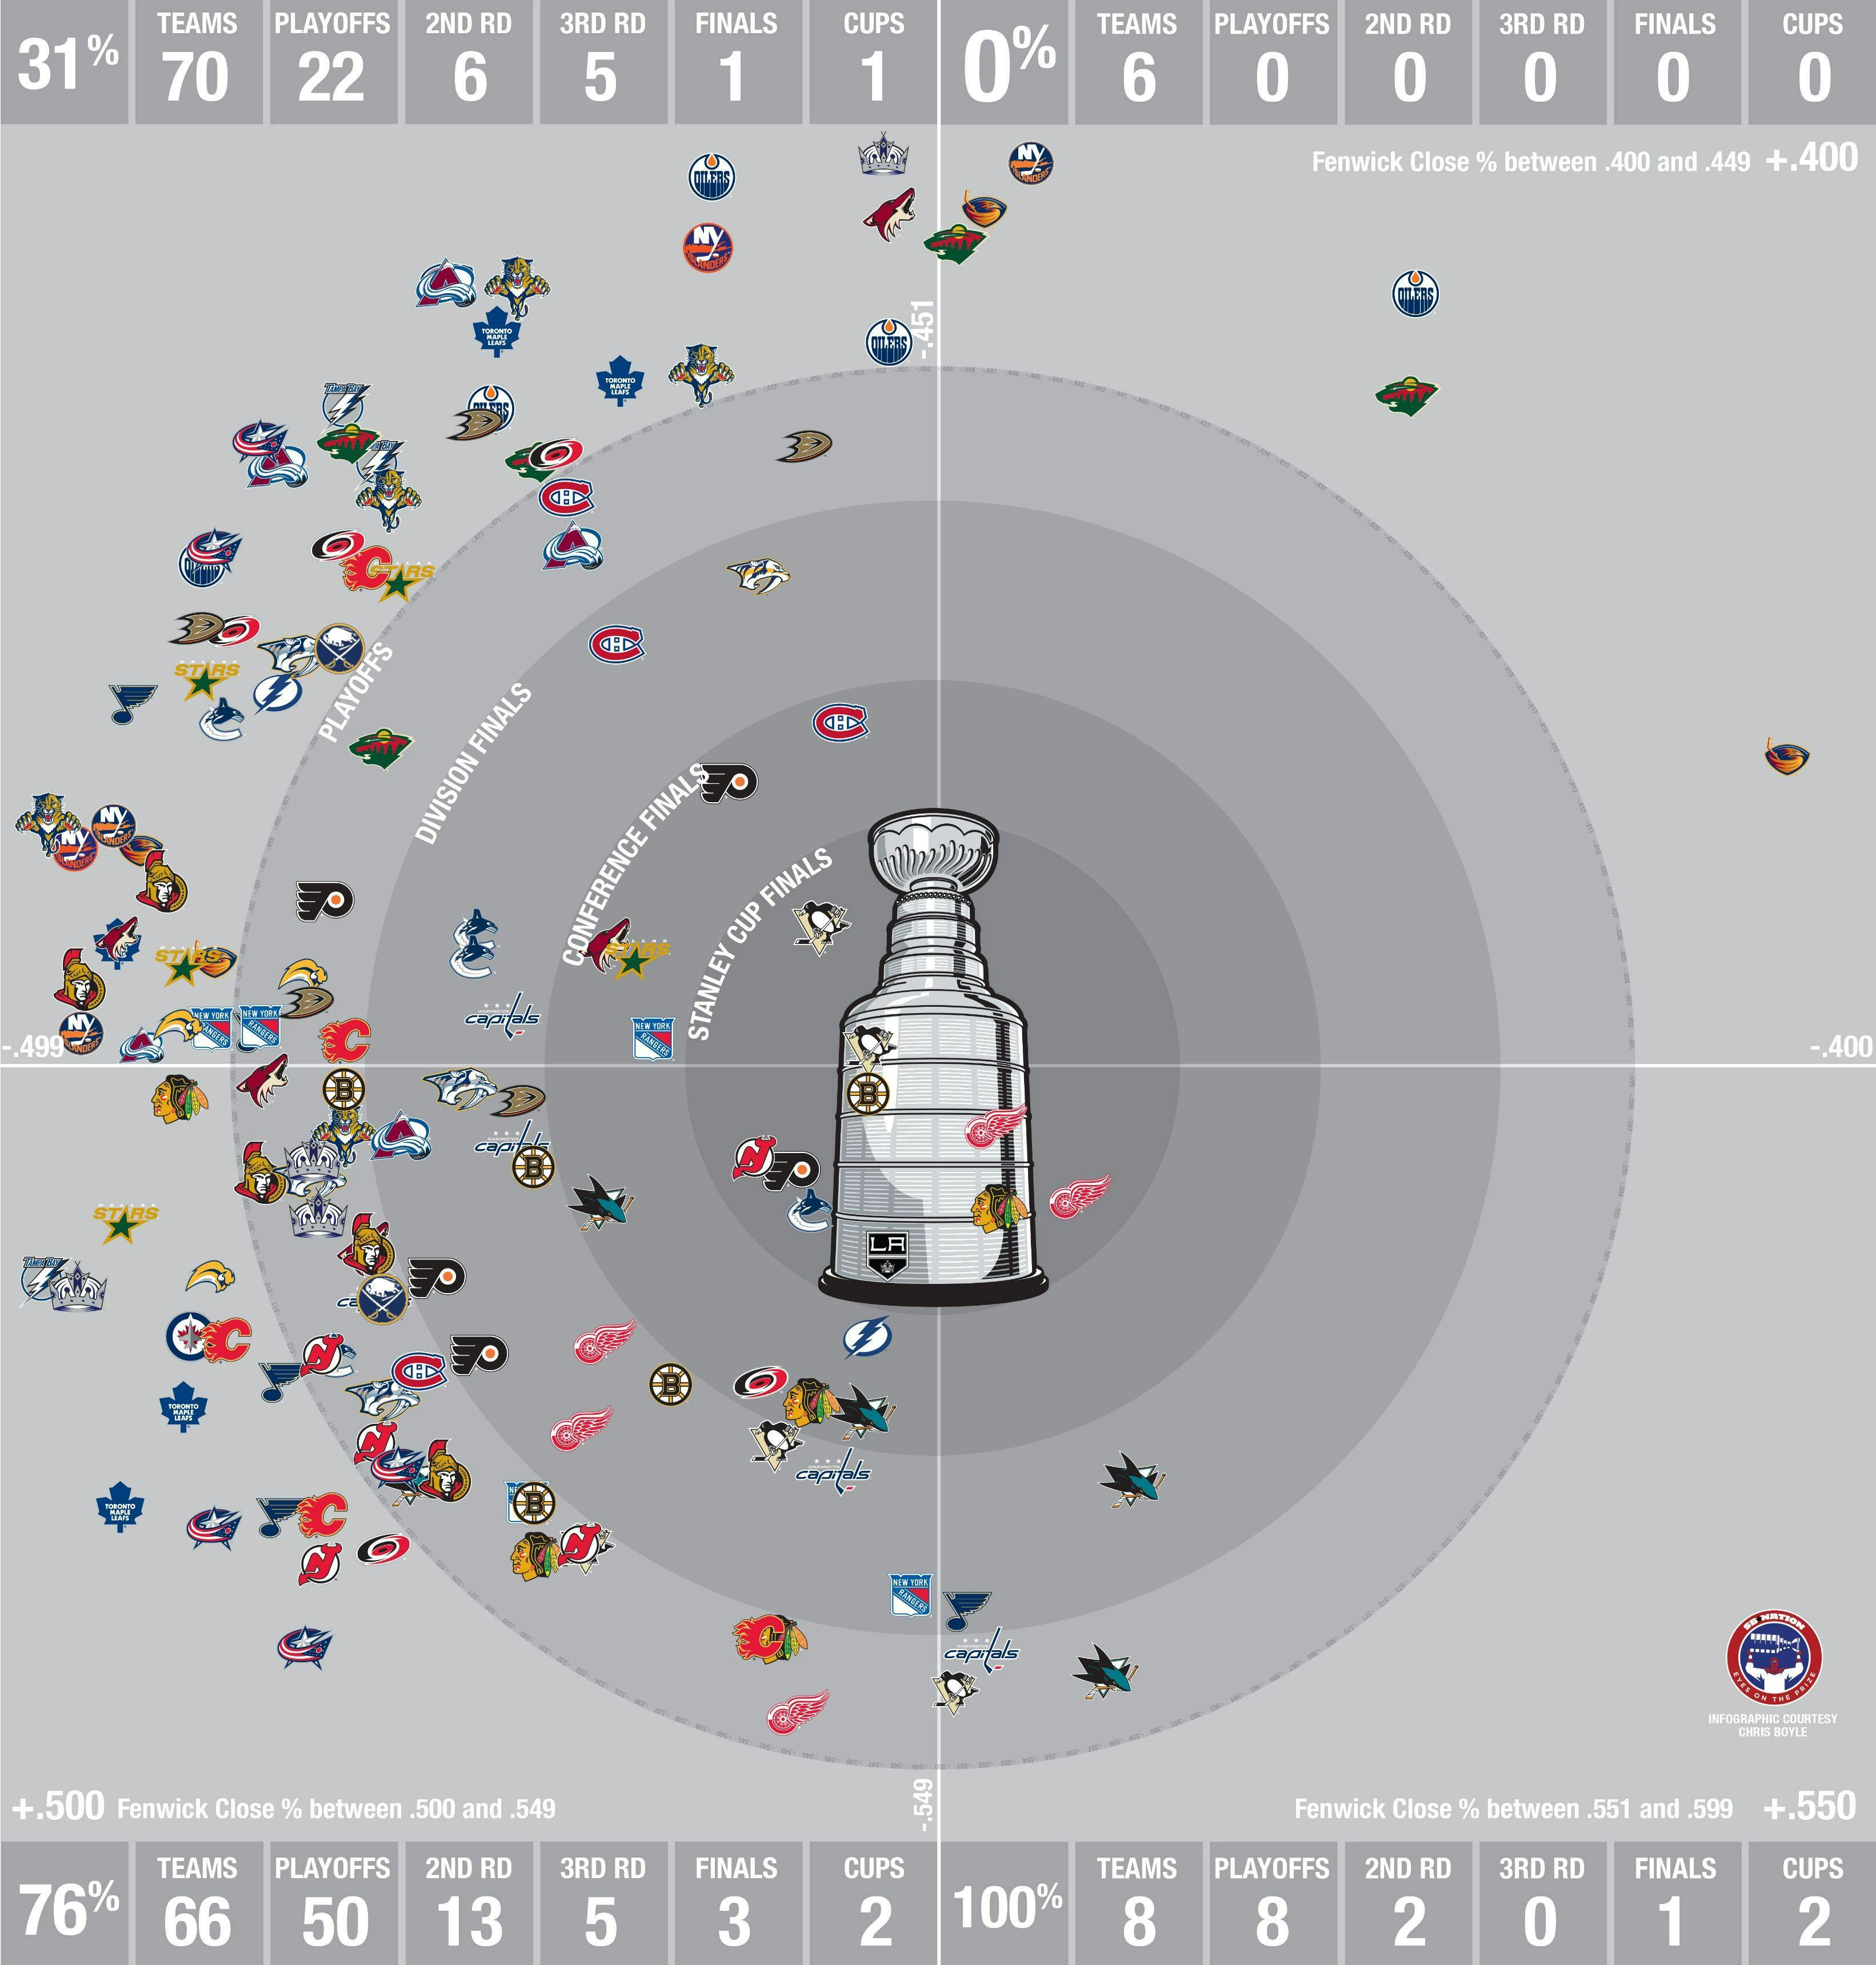
Chris explains:
I have charted every team’s fenwick close since 2007-2008. The rings of the graph represent each round of the Stanley Cup playoffs. The further the logo is away from the ring represents the distance from a playoff berth. I have also charted the percentage from .400 to .600. The further away from the .400 represents a stronger possession team. The ultimate on this index would be the 2008 Red Wings with a score of 59.39 located on the top portion of the Stanley Cup in the +.550 section. The 2008 Thrashers scrape the bottom of this index with a 41.23 and 28th position during the same season.
You can see the magic number of success is +.500. If you manage to crack this number you have a greater than 75% chance to qualify for the playoffs. If you break the +.550 mark you have a 25% probability of winning the Cup.
I’ll add to the discussion.
Since 2007-08 (not including last year), 75% (50/66) of teams with a possession ratio between 50-54.9% have made the playoffs, while 100% of clubs with a possession rate about 55% (8/8) have made the dance. On the other hand, just 31% of clubs with a corsi ratio below 50% made the playoffs over the same period (22/70), while no team below 44.9% made the dance. In very simple terms, then, every GM’s goal should be to build a +55% possession team (and to avoid building a sub-45% roster).
Controlling play is a big portion of success in the NHL. The last few seasons, the best teams in the league by this measure has been the LA Kings, Vancouver Canucks, Chicago Blackhawks, San Jose Sharks, Pittsburgh Penguins, Detroit Red Wings (though not this season) and the Boston Bruins. Recent entrants to the top of the field are the St. Louis Blues. If that looks like a list of the elite teams in the NHL, well…it is. While some clubs can experience spikes of success due to a spate of hot goaltending or an outburst of goal scoring, to be consistently successful in the NHL means to control the puck, spend more time in the offensive zone and out-chance the bad guys.
Having a great possession team means you aren’t wholly reliant on world class goaltending or unusually high shooting percentages to get by. Which is good, because those don’t tend to stick around forever (more on that in the future).
Summary: Take a look again at the graphic above and then glance at the current corsi ratios (CF%) for each team in the NHL. Given what you know, predict how each team will finish the year.
Next up – How to reference and use possession measures
Recent articles from Kent Wilson


