Beyond the Boxcars – Jay Bouwmeester
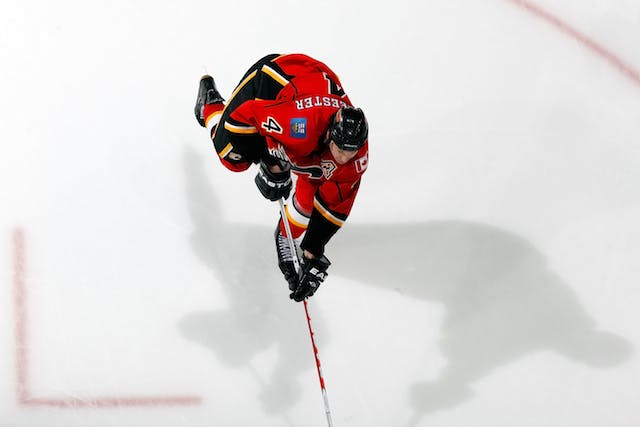
Jay Bouwmeester joined the Flames as the plum of the 2009 free agent class, as the Edmonton native returned to Alberta in order to complete the puzzle Darryl Sutter was constructing on the blueline. His arrival to work with Robyn Regher, Dion Phaneuf and Mark Giordano was intended to herald the beginning of an era where the Flames’ defence was the cornerstone of a successful franchise.
That didn’t exactly work out as planned, obviously. Bouwmeester’s scoring dried up when he moved to the more difficult Western Conference, although he and Giordano did make for a very solid pair most nights during the 09/10 season. In 10/11, the trade of Ian White cemented Bouwmeester as Robyn Regher’s partner on the primary shutdown pairing, and through about 65 games, that duo, and the team, were operating at a pretty decent level before things went sour to complete the year. What follows is a look at Bouwmeester’s 10/11, with his 5v5 scoring chance and possession numbers examined, in order to see what worked and what didn’t for the rearguard.
First, let’s look at Bouwmeester’s 5v5 work by the scoring chance metric, along with a couple of notable D partners:
5V5 | FOR | AGAINST | SC% | |
|---|---|---|---|---|
| Team | 1044 | 946 | 0.525 | |
| BOUWMEESTER | 437 | 399 | 0.523 | |
| REGHER | 342 | 339 | 0.502 | |
| 4 AND 28 | 255 | 253 | 0.502 | |
| 4 AND 5 | 85 | 65 | 0.567 |
Bouwmeester ran just a bit beind the team numbers, which isn’t ideal for a guy making 6.68M a year, but given the quality of opposition he faced and the club’s lack of genuinely elite forwards, not terrible either. His running mate Robyn Regher had a 5v5 SC percentage of 50.2%, which suggests that Bouwmeester got a few extra offensive opportunities over the course of the season, since their numbers working together were also 50.2%. Bouwmeester’s best partner was Giordano by the numbers, but it would be fair to note that the duo didn’t work together as often as in 09/10, and when they did play together, the team likely was chasing offence. More OZone starts, in other words, which would goose the totals.
One thing I did notice is the relatively limited effect Bouwmeester’s presence had on the SC numbers posted by the Flames’ top forwards. Hardly any of them really had much in the way of positive or negative changes to their SC percentage whether they were with Bouwmeester or not:
| Total | F | A | % | W/4 | F | A | % | WO/4 | F | A | % | |
|---|---|---|---|---|---|---|---|---|---|---|---|---|
| B. MORRISON | 213 | 206 | 50.8% | 80 | 76 | 51.3% | 133 | 130 | 50.6% | |||
| J. IGINLA | 430 | 371 | 53.7% | 212 | 172 | 55.2% | 218 | 199 | 52.3% | |||
| O. JOKINEN | 302 | 288 | 51.2% | 149 | 144 | 50.9% | 153 | 144 | 51.5% | |||
| R. BOURQUE | 262 | 300 | 46.6% | 114 | 123 | 48.1% | 148 | 177 | 45.5% | |||
| C. GLENCROSS | 269 | 237 | 53.2% | 118 | 100 | 54.1% | 151 | 137 | 52.4% | |||
| D. MOSS | 162 | 125 | 56.4% | 67 | 64 | 51.1% | 95 | 61 | 60.9% | |||
| A. TANGUAY | 354 | 301 | 54.0% | 176 | 144 | 55.0% | 178 | 157 | 53.1% |
Only Moss’ numbers look much different with JB backing him, but keep in mind that he had a good run centering the 4th line. When he had Bouwmeester behind him, he was likely facing a better quality of player as a rule. Those numbers hint to me that Bouwmeester might have been somewhat helpful for the top players in the main, but he wasn’t someone that drove the play on his own. I don’t doubt that the players in question might have had easier ZoneStarts when he wasn’t on the ice, so his positive effect, and that of Regher, might be slightly undercounted by this measure. Still, I would have liked to see more of a positive lift from having Bouwmeester backing the Flames’ better forwards.
Bouwmeester’s SC numbers look OK in general terms, and as we’ll see in a bit, run slightly ahead of his possession numbers. One thing that I was able to do with the outshooting figures from timeonice.com was break the season down into a couple of segments. As I’ve mentioned in the past, the Flames were a good outshooting team all season, but were particularly strong through about the first 65 games. I’ve used the St. Louis game on March 1st as a dividing line because Morrison and Moss were injured shortly thereafter, and as we all know, the team began its painful slide down to 10th.
To get started, here are Bouwmeester’s 5v5 full-season possession numbers when the game was tied. As a refresher, tied numbers are used to eliminate any padding of shooting totals due to score effect:
| Player | Shots% | F’Wick% | Corsi% | EVSV% | EVSH% | PDO |
|---|---|---|---|---|---|---|
| JAY BOUWMEESTER | 0.502 | 0.507 | 0.509 | 0.902 | 7.4% | 97.6 |
| Team | 0.526 | 0.520 | 0.513 | 0.910 | 7.1% | 98.1 |
Bouwmeester runs a fair bit behind the team by this metric, although like the club as a whole, you’ll notice his goaltenders didn’t exactly help him any. At any rate, those are pretty mediocre numbers for a high end defender on a decent team. Nik Lidstrom had numbers more in the .540 range across the board, just as one example. Lidstrom also had Datsyuk and Zetterberg carrying a nice chunk of the load, but I still expected a bit more from Bouwmeester in this regard, since the team was decent in the collective by this measure.
Again, though, what caught my eye as I examined the numbers was the cliff Bouwmeester fell off after the aforementioned St. Louis game. Through the first 65 games of the year, he was doing much better than his final totals. The next table shows Bouwmeester, along with Regher, Giordano, and all the top forwards except Moss and Morrison through game 65. I excluded those two because they were absent for the finish of the year, and I wanted to include players that were around for both of the segments I’m using. The order of stats is as with the table above:
| Team | 0.527 | 0.521 | 0.520 | 0.918 | 7.6% | 99.4 |
|---|---|---|---|---|---|---|
| JAY BOUWMEESTER | 0.515 | 0.524 | 0.528 | 0.913 | 8.2% | 99.5 |
| OLLI JOKINEN | 0.549 | 0.526 | 0.521 | 0.897 | 7.3% | 97.0 |
| JAROME IGINLA | 0.512 | 0.495 | 0.506 | 0.911 | 7.5% | 98.6 |
| ALEX TANGUAY | 0.503 | 0.487 | 0.499 | 0.920 | 8.5% | 100.5 |
| CURTIS GLENCROSS | 0.572 | 0.565 | 0.558 | 0.915 | 10.1% | 101.6 |
| RENE BOURQUE | 0.475 | 0.485 | 0.470 | 0.911 | 4.2% | 95.3 |
| ROBYN REGEHR | 0.509 | 0.507 | 0.501 | 0.913 | 7.9% | 99.2 |
| MARK GIORDANO | 0.530 | 0.522 | 0.518 | 0.911 | 5.1% | 96.2 |
Bouwmeester is running right along with the team to this juncture, and hasn’t had any exceptional luck to goose his boxcars. To this point, he really was doing well, since his numbers look a lot like Gio’s even with a heavier competitive burden factored in. It’s what happened from this point to the finish that was worrisome:
| Team | 0.524 | 0.514 | 0.485 | 0.879 | 5.2% | 93.1 |
|---|---|---|---|---|---|---|
| JAY BOUWMEESTER | 0.449 | 0.437 | 0.434 | 0.862 | 3.8% | 90.0 |
| OLLI JOKINEN | 0.524 | 0.523 | 0.484 | 0.923 | 4.7% | 97.0 |
| JAROME IGINLA | 0.486 | 0.472 | 0.452 | 0.870 | 9.8% | 96.8 |
| ALEX TANGUAY | 0.460 | 0.450 | 0.420 | 0.870 | 10.9% | 97.9 |
| CURTIS GLENCROSS | 0.568 | 0.509 | 0.481 | 0.857 | 4.3% | 90.0 |
| RENE BOURQUE | 0.547 | 0.508 | 0.487 | 0.930 | 5.8% | 98.8 |
| ROBYN REGEHR | 0.481 | 0.465 | 0.463 | 0.833 | 2.0% | 85.3 |
| MARK GIORDANO | 0.571 | 0.544 | 0.510 | 0.917 | 7.8% | 99.5 |
…and right off the planet he went. The team was slightly worse than they’d been, and Tanguay’s numbers look almost as crappy, but that slide from the good side of the shot clock to Oileresque numbers is stunning for a player of Bouwmeester’s pedigree. Players have slumps, of course, and he certainly didn’t get a bounce at any point during this stretch, but holy hell, those possession numbers are inexcusable for a top-end defenceman.
As a rule, I’m inclined to give Bouwmeester quite a bit of latitude because of the load that the Flames ask him to carry. That said, he was legitimately terrible to finish the season, and while I’d be shocked if that level of play carried over for another three years, the Flames must be wondering what exactly they’re paying for.
I think what’s most concerning is that he really didn’t drive results in the manner that an elite defender would be expected to, and since the Flames are paying him elite dollars, that can’t sit well with the management or the fans. His contract might render him largely untradable as well, so an exit strategy isn’t likely to be easily found. If we’ve seen all Bouwmeester can be, he’s being overpaid by at least 2 million a year. He’s not the only player on the roster that can be said about, but the really expensive players have to perform if a team wants to compete, and what we saw from Jay Bouwmeester when the Flames needed one last rush this spring wasn’t close to good enough. Unless he has more in the tank than what we’ve observed from him thus far in Calgary, the next three years might be very long indeed.
Recent articles from Robert Cleave

