Black Box: Week 16

12 years ago
After a highly successful road trip Hockey-Reference.com currently puts Calgary’s chances of a post-season berth at 28.7%. What impact will having their leading scorer, top penalty-killer and best shut-down forward Curtis Glencross out of the line-up for 6-8 weeks?
OZQoC Charts (explanation)
The OZQoC Chart shows just how significant Curtis Glencross’s absence from the line-up may be – he plays the top opponents and doesn’t shirk from playing the defensive zone. The absence of two top-six forwards (Glencross and Tanguay) means somebody will have to step up to play alongside the remaining four (Jokinen, Iginla, Backlund and Cammalleri).
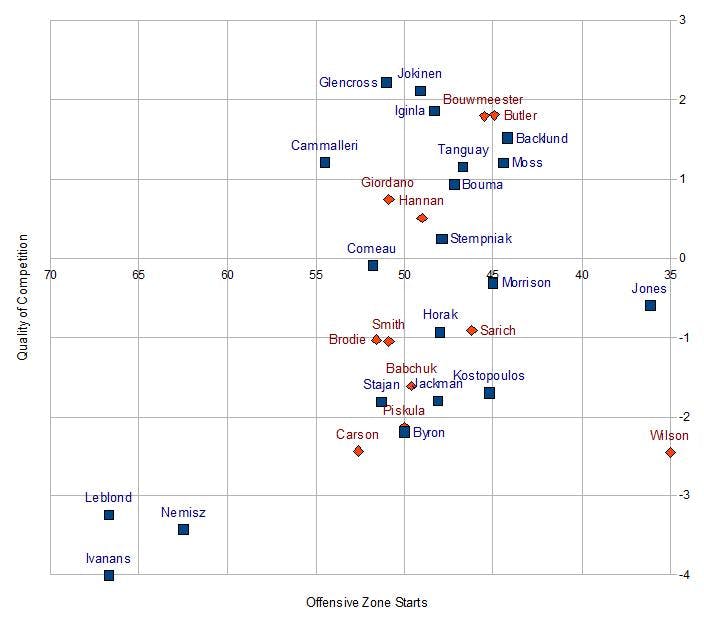
Lee Stempniak is an obvious choice, but will the sixth prove to be veteran Brendan Morrison, rookie Lance Bouma, or utility forward Blake Comeau?
Even-Strength Scoring (explanation)
Hockey’s a team sport, and it can be difficult to assign individual credit for team success, which is why we simply rank the players based on the degree of team success with each player on the ice.
Furthermore, we rank the players based on our best estimate of team success: shot-based possession statistics like Corsi Events (CE%) rather than goals, which is heavily luck-based when there’s so little data.
So we’re not saying that Matt Stajan is Calgary’s best player, but we are saying that the Calgary Flames have the puck more often with Matt Stajan on the ice than anyone else. Looking at the OZQoC chart above, that stands perfectly to reason because Stajan plays against weak competition.
This is why we make the point once more about how good Mikael Backlund is actually playing. Unlike Stajan, Backlund is playing the very best competition, and often starting in the defensive zone, and yet Calgary controls the play 52.8% of the time when he’s on the ice – far more than Curtis Glencross (45.2%), Jarome Iginla (46.0%), Olli Jokinen (45.2%) and Alex Tanguay (48.0%).
Forward        ESP/60 CEF CEA  CE% SCF SCA SC%   GF   GA    G%
Matt Stajan      1.0   54  47 53.8% 14 13 51.6% 1.66 2.70  38.1%
David Moss       1.9   55  49 53.0% 11 14 43.3% 1.85 1.48  55.6%
Mikael Backlund  1.1   55  49 52.8% 16 15 51.7% 1.74 3.08  36.1%
Lee Stempniak    1.9   54  51 51.4% 16 14 52.1% 2.68 2.78  49.1%
Tim Jackman      1.0   52  50 51.0% 12 13 48.0% 1.09 3.01  26.6%
Blake Comeau     1.0   50  50 50.0% 12 12 49.3% 1.16 2.52  31.5%
Tom Kostopoulos  0.9   49  50 49.6% 11 11 50.3% 1.47 2.70  35.3%
Mike Cammalleri  1.7   50  53 48.3% 11 17 40.0% 2.48 3.12  44.3%
Alex Tanguay     1.8   50  54 48.0% 19 15 55.8% 2.48 2.62  48.6%
Brendan Morrison 1.5   46  54 46.2% 15 16 47.9% 2.20 2.20  50.0%
Jarome Iginla    2.0   50  59 46.0% 16 17 48.4% 2.45 2.60  48.5%
Lance Bouma      0.9   45  54 45.5% 16 14 52.9% 1.78 0.00 100.0%
Curtis Glencross 2.3   48  58 45.2% 14 17 45.7% 2.84 3.04  48.3%
Olli Jokinen     2.1   49  59 45.2% 15 17 46.4% 3.20 2.87  52.7%
Greg Nemisz      0.0   34  43 44.5%  4  9 33.3% 0.00 0.00   0.0%
P-L. Leblond     0.0   46  58 43.9%  8 12 40.0% 4.16 0.00 100.0%
Blair Jones      1.0   40  52 43.7% 19 18 51.3% 1.20 1.44  45.5%
Roman Horak      1.3   40  52 43.6% 13 12 51.1% 1.99 1.42  58.4%
Paul Byron       1.0   34  52 39.7% 11 11 50.0% 1.65 0.66  71.4%
Raitis Ivanans   0.0   27  65 29.4%  5 27 16.7% 0.00 5.41   0.0%
If we’re right, then eventually the other two sets of percentages will begin to match the Corsi data. First the scoring chance data (since there is more of it), then the goal data. You can see that Backlund’s scoring chance data already matches his corsi event data – much as it does for most Flames – but the goal rate is still far off.
The goal data will probably begin to match first for the players who get the most ice-time, and right now that’s Jay Bouwmeester. And lookie lookie – his goal rates has gradually but ultimately matched his corsi rate. This isn’t a new trend. It happens every year, and that’s why we speak with such confidence that Backlund’s numbers will eventually come around.
Defense        ESP/60 CEF CEA  CE% SCF SCA SC%   GF   GA    G%
Brett Carson     0.0   70  41 63.4% 19 11 63.6% 0.00 5.41   0.0%
T.J. Brodie      0.7   49  46 51.5% 14 13 52.4% 2.34 2.22  51.3%
Cory Sarich      0.3   49  48 50.5% 13 11 54.9% 1.81 2.06  46.8%
Derek Smith      0.8   50  50 49.9% 15 13 52.3% 2.08 1.82  53.3%
Chris Butler     0.6   50  54 48.2% 16 17 49.3% 2.57 2.36  52.1%
Jay Bouwmeester  0.7   50  54 47.7% 15 17 47.6% 2.32 2.58  47.3%
Mark Giordano    0.7   49  57 46.1% 14 14 49.3% 2.14 2.27  48.5%
Joe Piskula      0.0   50  59 45.9% 19 14 56.7% 0.00 5.54   0.0%
Scott Hannan     0.5   44  57 43.9% 14 17 44.6% 2.30 2.93  44.0%
Anton Babchuk    0.9   39  60 39.8%  8 17 32.5% 1.45 1.74  45.5%
Clay Wilson      0.0   29  48 37.5%  5 12 28.6% 0.00 0.00   0.0%
Special teams (explanation)
Top power play quarterback Anton Babchuk was used sparingly at even-strength, and not at all with the man advantage. Unless there are injury-related factors at play his future with the club could be in question – the smart minds over at CapGeek pointed out that the Flames need to clear about $1.2 million in cap space before players start returning from injured reserve.
Player              TOI/GP PTS/60 CE/60
Clay Wilson          2.5     0.0  130.7
Anton Babchuk        1.9     3.8   99.5
Mike Cammalleri      2.9     2.5   94.0
David Moss           1.3     0.0   88.7
Mikael Backlund      1.1     3.1   86.4
Roman Horak          0.6     0.0   84.7
Lee Stempniak        1.8     2.1   79.2
Jay Bouwmeester      2.6     3.8   77.8
Chris Butler         0.8     3.1   77.3
Jarome Iginla        3.3     4.5   76.7
Olli Jokinen         3.0     5.3   76.3
Blair Jones          0.7     0.0   76.2
Alex Tanguay         3.4     4.8   73.4
Tim Jackman          0.4     0.0   70.0
Mark Giordano        3.3     2.6   69.7
T.J. Brodie          2.0     4.3   65.8
Derek Smith          1.4     5.2   65.1
Curtis Glencross     1.9     6.2   64.5
Brendan Morrison     1.2     3.7   64.0
Blake Comeau         0.7     0.0   57.9
You have to go back to the 1999-2000 Boston Bruins to find the last team who went an entire year without a short-handed goal. It was an odd year – St. Louis won the President’s Trophy, Valeri Bure led the Flames in goals and points, Chris Pronger won the Hart Trophy, Olaf Kolzig won the Vezina and Mark Recchi led the league in assists.
Player           TOI/GP CE/60
Jay Bouwmeester   3.6    86.3
Scott Hannan      2.7    80.9
Chris Butler      2.3    90.0
Curtis Glencross  2.2    87.0
Mark Giordano     2.1    91.5
Lee Stempniak     1.7    75.1
David Moss        1.5   143.1
Tom Kostopoulos   1.3    83.6
Blake Comeau      1.1    76.5
Mikael Backlund   1.0    88.7
Mike Cammalleri   1.0    69.0
Alex Tanguay      0.9    70.3
Matt Stajan       0.6   133.8
Cory Sarich       0.6   111.7
Olli Jokinen      0.5    76.9
Blair Jones       0.5    69.8
Derek Smith       0.4    60.0
Brendan Morrison  0.3    95.5
Brett Carson      0.3   109.1
Roman Horak       0.3   115.2
The absence of Curtis Glencross will hurt them here most, and it might be a good opportunity to give more time to either Mikael Backlund, or skilled veteranslike Mike Cammalleri and Olli Jokinen.
Goaltending (explanation)
Miikka Kiprusoff’s solid play between the pipes played no small role in Calgary’s successful road trip. His .929 even-strength save percentage is way up from last year’s .916, and is 9th in the league among goalies with at least 20 starts.
Goalie           GS QS   QS%  ESSV%
Miikka Kiprusoff 40 25  62.5%  .929
Leland Irving     4  3  75.0%  .909
Henrik Karlsson   5  1  20.0%  .904
16 weeks are in the books, and Calgary is in a familiar position: 10th place, 2 points out of the final post-season position. Leading goal scorer and top penalty-killer Curtis Glencross is out for 6-8 weeks, and the Flames are looking at a mighty tough stretch as some of the West’s best teams come to town: San Jose, Detroit and Chicago.
Recent articles from Robert Vollman