Black Box: Week 18
Calgary lost two of three since our last update, dropping their chances of making the post-season to the 20%-23% range. Brendan Morrison is gone, making room for Krys Kolanos, who played his first NHL game in three years.
OZQoC Charts (explanation)
The OZQoC Chart is critical for having the correct context to understand all the statistics to follow. Without this simple chart you might think that Matt Stajan is the best forward on the team, when in actuality he is simply the one who gets the easiest ice-time.
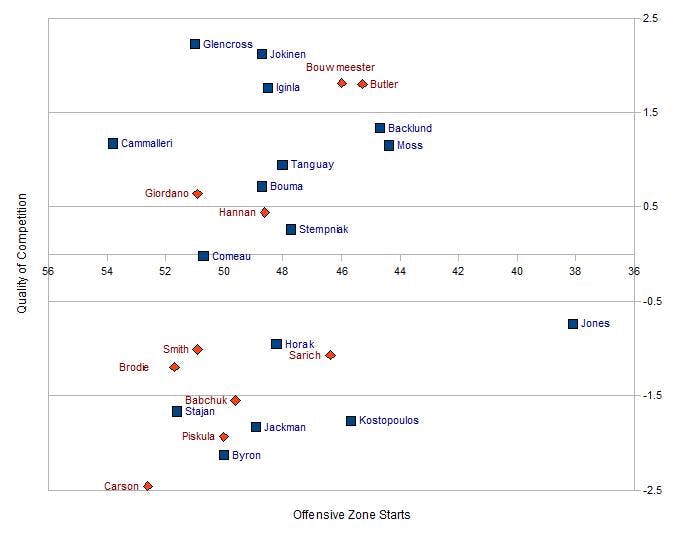
Actually, Paul Byron gets the easiest ice-time among forwards, but still manages to get the team’s worst results. As we’ve said before, the most impressive forward is Mikael Backlund, who is somehow among the team’s possession leaders despite playing in the most difficult situations.
Even-Strength Scoring (explanation)
Having Curtis Glencross and Lee Stempniak on IR, while Alex Tanguay and Mike Cammalleri struggle to score at even-strength leaves the Flames with just two players – Olli Jokinen and Jarome Iginla – currently scoring at a top-six level at even-strength (1.8 even-strength points per 60 minutes).
Forward        ESP/60 CEF CEA  CE% SCF SCA SC%   GF   GA    G%
Matt Stajan      1.0   54  46 54.1% 13 12 51.1% 1.61 2.82  36.3%
David Moss       1.9   55  49 53.0% 11 14 43.3% 1.85 1.48  55.6%
Mikael Backlund  1.0   54  50 52.1% 16 15 50.8% 1.64 3.15  34.2%
Lee Stempniak    1.9   54  51 51.3% 16 15 51.7% 2.61 2.70  49.2%
Tim Jackman      0.9   51  49 51.1% 11 12 47.8% 1.05 3.03  25.7%
Tom Kostopoulos  0.8   50  49 50.4% 12 12 50.3% 1.40 2.68  34.3%
Blake Comeau     0.9   50  50 50.1% 12 13 49.0% 1.10 2.40  31.4%
Alex Tanguay     1.7   50  53 48.7% 19 15 56.2% 2.33 2.59  47.4%
Lance Bouma      0.8   52  55 48.6% 15 15 50.0% 1.54 0.00 100.0%
Mike Cammalleri  1.6   49  53 48.4% 17 20 45.6% 2.33 3.14  42.6%
Blair Jones      0.9   44  50 46.9% 18 16 53.8% 1.09 1.31  45.4%
Jarome Iginla    1.9   50  58 46.3% 17 18 49.1% 2.34 2.70  46.4%
Olli Jokinen     2.0   49  59 45.3% 15 18 46.7% 3.06 2.82  52.0%
Curtis Glencross 2.3   48  58 45.2% 14 17 45.7% 2.84 3.04  48.3%
Greg Nemisz      0.0   34  43 44.5%  4  9 33.3% 0.00 0.00   0.0%
P-L. Leblond     0.0   46  58 43.9%  8 12 40.0% 4.16 0.00 100.0%
Roman Horak      1.3   40  51 43.7% 13 12 51.1% 1.96 1.40  58.3%
Paul Byron       1.0   34  52 39.7% 11 11 50.0% 1.65 0.66  71.4%
Raitis Ivanans   0.0   27  65 29.4%  5 27 16.7% 0.00 5.41   0.0%
The situation on the blue line could get interesting if the Flames continue to lose, because Cory Sarich and Scott Hannan are both unrestricted free agents at the end of the season. Hannan plays top-four minutes and kills penalties, but has really struggled, while Cory Sarich can be described as playing reasonably well in a third-line defense-only role.
Defense        ESP/60 CEF CEA  CE% SCF SCA SC%   GF   GA    G%
Brett Carson     0.0   70  41 63.4% 19 11 63.6% 0.00 5.41   0.0%
T.J. Brodie      0.7   50  46 51.9% 14 13 52.7% 2.20 2.09  51.3%
Cory Sarich      0.2   49  48 50.8% 13 11 54.0% 1.71 2.07  45.2%
Derek Smith      0.8   50  50 49.9% 15 13 52.3% 2.08 1.82  53.3%
Chris Butler     0.6   50  54 48.3% 16 17 49.2% 2.46 2.46  50.0%
Jay Bouwmeester  0.7   50  54 48.0% 15 17 47.9% 2.22 2.59  46.2%
Mark Giordano    0.6   49  56 46.6% 14 14 49.6% 1.99 2.24  47.0%
Joe Piskula      0.0   50  59 45.9% 19 14 56.7% 0.00 5.54   0.0%
Scott Hannan     0.5   44  56 44.0% 13 17 43.6% 2.21 2.90  43.2%
Anton Babchuk    0.9   39  60 39.8%  8 17 32.5% 1.45 1.74  45.5%
Clay Wilson      0.0   29  48 37.5%  5 12 28.6% 0.00 0.00   0.0%
Special teams (explanation)
Calgary’s power play has been above average most of the season, currently sitting 13th overall, but they’ve been doing this despite not getting a lot of shots on net. Curtis Glencross scored at the highest rate at the time of his injury, but Calgary barely got a shot a minute when he was on the ice – Lee Stempniak is dead last among (regular) forwards in personal scoring rate with the man advantage, but give all the shots they get with him on the ice, his absence might hurt more than Glencross’s.
Player              TOI/GP PTS/60 CE/60
Clay Wilson          2.5     0.0  130.7
Anton Babchuk        1.9     3.8   99.5
Mike Cammalleri      2.9     2.9   95.9
David Moss           1.3     0.0   88.7
Mikael Backlund      1.1     3.0   86.3
Roman Horak          0.5     0.0   84.7
Lee Stempniak        1.7     2.0   78.6
Jarome Iginla        3.2     4.4   78.5
Olli Jokinen         3.0     5.5   78.3
Jay Bouwmeester      2.5     3.8   78.2
Chris Butler         0.8     3.1   76.5
Alex Tanguay         3.3     5.2   75.1
Blair Jones          0.6     0.0   73.6
Mark Giordano        3.2     2.5   73.3
Tim Jackman          0.4     0.0   70.8
T.J. Brodie          1.9     4.3   65.5
Derek Smith          1.4     5.2   65.1
Curtis Glencross     1.9     6.2   64.5
Blake Comeau         0.7     0.0   57.9
Calgary could become the first team in 12 years to go an entire season with a short-handed goal, but their penalty kill has been otherwise decent. In fact, their power play and their penalty killing rate is almost exactly the same as Anaheim’s and they’re doing really we…never mind.
Player           TOI/GP CE/60
Jay Bouwmeester   3.5    86.2
Scott Hannan      2.6    80.6
Chris Butler      2.3    89.3
Curtis Glencross  2.2    87.0
Mark Giordano     2.0    90.2
Lee Stempniak     1.7    76.2
David Moss        1.5   143.1
Tom Kostopoulos   1.3    83.0
Blake Comeau      1.1    74.8
Mikael Backlund   1.0    88.3
Alex Tanguay      0.9    67.3
Mike Cammalleri   0.9    69.0
Matt Stajan       0.6   133.8
Blair Jones       0.6    69.1
Cory Sarich       0.5   108.6
Olli Jokinen      0.5    76.9
Derek Smith       0.4    60.0
Brett Carson      0.3   109.1
Roman Horak       0.3   115.2
Lance Bouma       0.2   111.3
Goaltending (explanation)
We shudder to think how bad the Flames would be this season without Miikka Kiprusoff (or how good they would have been last year).
Goalie           GS QS   QS%  ESSV%
Miikka Kiprusoff 43 27  62.8%  .929
Leland Irving     4  3  75.0%  .909
Henrik Karlsson   5  1  20.0%  .904
That’s it – 18 weeks down, and 3 to go before the trade deadline. Best case scenario Calgary makes the most of a light schedule and wins an uphill battle to secure a play-off spot. Next best scenario is they tank the next couple of weeks, and trade off some UFAs for picks and prospects, and focus on next year. Worst case scenario is they do really well the next few weeks, but tank after the deadline and finish 9th or 10th for the third straight season.
Recent articles from Robert Vollman

