Black Box: Week 21

12 years ago
“Another random boring Vollman article. Stats add a bit of colour but cannot replace good hockey sense and ignore important subjective elements like heart and leadership. Put that in your pocket protector!” – Vollman’s #1 fan Kenta
A tough 3-loss week for the Flames drags their post-season potential back down to the 27-32% range into the close race for 8th with Dallas, Los Angeles and Colorado. Their only regulation loss of February was at the hands of the 29th place Edmonton Oilers – who actually have a better goal differential than the Flames!
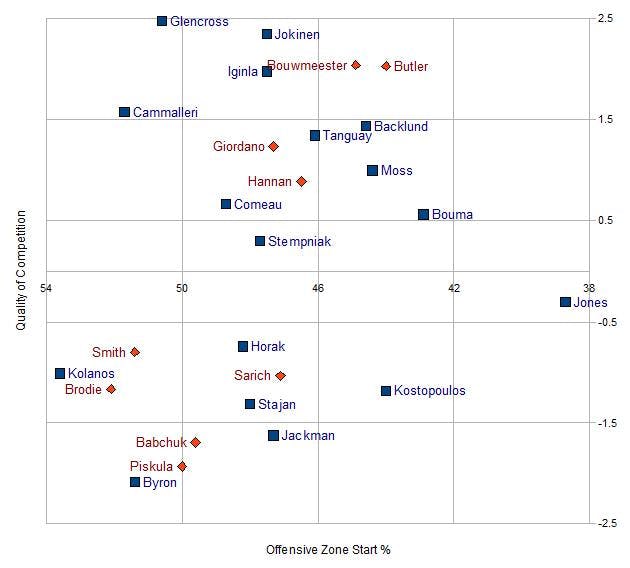
OZQoC Charts (explanation)
No big surprises on this week’s OZQoC chart, which shows how Brent Sutter refuses to tilt the ice in anyone’s favour with advantageous zone start situations, but how he definitely likes matching lines.
Even-Strength Scoring (explanation)
Of Calgary’s top-six forwards, only with Mikael Backlund have the Flames enjoyed the majority of on-ice shots at even-strength. Mike Cammalleri has been a scoring chance machine – for the opposing team that is – and lauded scorer Olli Jokinen is getting killed at even-strength everywhere except the scoresheet. Given his good fortune and UFA status, he might be excellent trade bait at today’s deadline.
The good news is that Alex Tanguay, the only Flame other than Backlund above water in scoring chances – now has the highest even-strength scoring rate on the team, holding that baton for the first time after it was exchanged back-and-forth by Curtis Glencross and Olli Jokinen most of the season.
Top-Six Forward ESP/60 CEF CEA  CE% SCF SCA SC%   GF   GA    G%
Mikael Backlund  0.9   53  50 51.6% 16 14 51.7% 1.57 2.92  35.0%
Mike Cammalleri  1.6   48  54 47.1% 16 22 42.5% 2.25 3.00  42.9%
Alex Tanguay     2.3   47  57 45.3% 18 17 51.4% 3.04 2.33  56.6%
Curtis Glencross 2.2   47  58 44.8% 14 17 44.5% 2.76 3.05  47.5%
Jarome Iginla    2.0   48  60 44.4% 16 19 46.4% 2.53 2.77  47.7%
Olli Jokinen     2.2   47  60 43.7% 15 19 44.6% 3.23 2.93  53.3%
Injuries have forced some of Calgary’s forwards to play on higher lines than normal – Blake Comeau and Tom Kostopoulos actually got a shot on the 2nd line last Monday. It was unfortunately a tough week on the scoreboard for Comeau and Lance Bouma.
3rd Line Forward ESP/60 CEF CEA  CE% SCF SCA SC%   GF   GA    G%
David Moss       1.9   55  49 53.0% 11 14 43.3% 1.85 1.48  55.6%
Lee Stempniak    1.9   54  51 51.3% 16 15 51.7% 2.61 2.70  49.2%
Blake Comeau     0.9   49  52 48.6% 13 16 45.5% 1.22 2.44  33.3%
Lance Bouma      0.7   45  52 46.4% 14 13 52.3% 1.00 1.67  37.5%
Blair Jones      0.9   44  52 45.7% 19 19 50.6% 1.11 1.29  46.3%
There are those who believe that the last line of Matt Stajan, Tim Jackman and Tom Kostopoulos have been awful this year – but the Flames have essentially been even in both shots and scoring chances with them on the ice. For some reason when they’re on the ice the team can’t put the puck in the net, nor keep it out of their own, try as they might.
The opposite holds true for Roman Horak and Paul Byron. The Flames get absolutely crushed shot-wise with either of them on the ice (despite playing weak competition), but somehow get the bulk of the scoring chances and the goals. You figure it out.
Depth Forward  ESP/60 CEF CEA  CE% SCF SCA SC%   GF   GA    G%
Matt Stajan      0.9   51  47 52.2% 12 13 49.7% 1.38 2.75  33.4%
Tim Jackman      0.8   50  48 50.8% 11 12 47.9% 0.89 2.91  23.4%
Tom Kostopoulos  0.7   50  52 48.7% 12 13 47.5% 1.45 2.71  34.9%
Krys Kolanos     0.8   50  53 48.5% 11 10 51.6% 1.49 1.49  50.0%
Greg Nemisz      0.0   34  43 44.5%  4  9 33.3% 0.00 0.00   0.0%
P-L. Leblond     0.0   46  58 43.9%  8 12 40.0% 4.16 0.00 100.0%
Roman Horak      1.3   40  51 43.6% 13 12 51.5% 2.04 1.53  57.1%
Paul Byron       1.1   35  51 40.7% 11 11 51.3% 1.70 0.57  74.9%
Raitis Ivanans   0.0   27  65 29.4%  5 27 16.7% 0.00 5.41   0.0%
With Mark Giordano’s rough week goal-wise, none of Calgary’s top four defensemen are above water in either shots, scoring chances or goals – although Chris Butler managed an even goal differential. Is this really a play-off team?
Top-4 Defense  ESP/60 CEF CEA  CE% SCF SCA SC%   GF   GA    G%
Chris Butler     0.6   49  57 46.5% 16 18 47.7% 2.47 2.47  50.0%
Jay Bouwmeester  0.6   49  56 46.5% 15 18 46.1% 2.18 2.55  46.1%
Mark Giordano    0.7   46  56 44.9% 14 15 47.4% 2.13 2.23  48.9%
Scott Hannan     0.6   42  56 42.9% 13 17 42.9% 2.21 2.72  44.8%
Should prices for defensemen get high enough to entice Jay Feaster to unload some UFAs and spare parts on the blue line, Cory Sarich could make a solid (albeit expensive) third-line addition – keeping his team even all year, and keeping scoring down (at both ends of the ice, unfortunately). Anton Babchuk would be a terrible pick-up at even-strength, but quite useful with the man advantage, as we’ll see shortly.
Depth Defense  ESP/60 CEF CEA  CE% SCF SCA SC%   GF   GA    G%
Brett Carson     0.0   70  41 63.4% 19 11 63.6% 0.00 5.41   0.0%
T.J. Brodie      0.6   49  46 51.5% 14 13 52.1% 2.26 2.26  50.0%
Cory Sarich      0.4   48  48 50.1% 13 12 51.7% 1.77 2.37  42.8%
Derek Smith      0.8   49  51 49.3% 14 13 52.4% 2.01 1.76  53.3%
Joe Piskula      0.0   50  59 45.9% 19 14 56.7% 0.00 5.54   0.0%
Anton Babchuk    0.9   39  60 39.8%  8 17 32.5% 1.45 1.74  45.5%
Clay Wilson      0.0   29  48 37.5%  5 12 28.6% 0.00 0.00   0.0%
Special teams (explanation)
The bounces are slowly starting to go Mike Cammalleri’s way, but despite how well his teams have done with him working the man advantage, his personal scoring is far lower than any of his Calgary peers. Fortune instead has smiled up on Olli Jokinen – Calgary’s most effective power play specialist for years – enjoying a much higher scoring rate than Jarome Iginla despite identical team results.
Primary Forwards    TOI/GP PTS/60 CE/60
Mike Cammalleri      3.0     3.0   96.2
Jarome Iginla        3.3     4.2   81.2
Olli Jokinen         3.1     5.5   81.2
Alex Tanguay         3.3     4.5   78.5
Curtis Glencross’ return has been timely, given injuries to three of Calgary’s five secondary power play forwards, and the coaching staff’s reluctance to continue the Kolanos experiment any further. Despite the team’s inability to control the play and get shots with Glencross on the ice, he nevertheless enjoys the highest personal scoring rate on the team with the man advantage.
Secondary Forwards  TOI/GP PTS/60 CE/60
David Moss           1.3     0.0   88.7
Mikael Backlund      1.1     3.9   85.0
Lee Stempniak        1.7     2.0   78.6
Krys Kolanos         1.2     0.0   75.5
Curtis Glencross     1.9     6.1   64.1
Blake Comeau is the only other Flame forward to get power play opportunities this week, which is unfortunate given that he’s gotten the fewest results this season.
Depth Forwards     TOI/GP PTS/60 CE/60
Roman Horak          0.5     0.0   84.9
Blair Jones          0.8     2.2   73.6
Tim Jackman          0.4     0.0   73.1
Blake Comeau         0.7     0.0   62.0
Should he be dealt somewhere by tomorrow, Anton Babchuk could be a usable power play specialist, albeit an expensive one. Derek Smith’s personal scoring rate with the man advantage may be the highest, but the team controls the play and gets far more shots with Jay Bouwmeester on the ice.
Defensemen          TOI/GP PTS/60 CE/60
Clay Wilson          2.5     0.0  130.7
Anton Babchuk        1.9     3.8   99.5
Jay Bouwmeester      2.4     3.8   80.4
Chris Butler         0.7     2.9   79.7
Mark Giordano        3.3     2.3   77.2
T.J. Brodie          1.8     3.5   67.3
Derek Smith          1.4     5.2   66.3
Just when their top penalty killing forward Curtis Glencross returned, one of their top penalty killing defensemen Chris Butler went on the shelf.
Primary Forwards TOI/GP CE/60
Lee Stempniak     1.7    76.2
Blake Comeau      1.1    78.8
Curtis Glencross  2.2    85.0
Tom Kostopoulos   1.2    86.3
Mikael Backlund   1.0    90.5
David Moss        1.5   143.1
This week Brent Sutter experimented with almost all his secondary penalty-killing forwards, except potentially his best option, Mike Cammalleri – though this is admittedly a small sample size.
Depth Forwards   TOI/GP CE/60
Mike Cammalleri   0.8    69.0
Alex Tanguay      1.0    77.9
Olli Jokinen      0.5    78.6
Blair Jones       0.6    79.7
Roman Horak       0.2   115.8
Lance Bouma       0.5   128.8
Matt Stajan       0.7   125.0
While we have criticized Scott Hannan’s play at even-strength, it has been unquestionably solid when down a man.
Primary Defense  TOI/GP CE/60
Scott Hannan      2.5    83.0
Mark Giordano     1.8    87.0
Jay Bouwmeester   3.3    89.5
Chris Butler      2.2    92.2
Brent Sutter has been extremely reluctant to play anyone outside his top four when killing penalties, so the most likely scenario in Butler’s absence is a three-man rotation, which is unfortunate given Derek Smith’s success in his limited opportunities this year.
Depth Defense    TOI/GP CE/60
Derek Smith       0.4    59.7
Brett Carson      0.3   109.1
Cory Sarich       0.5   105.0
Goaltending (explanation)
This week the Flames got a reminder what happens when Miikka Kiprusoff returns to mortal status, as he went 0-for-3 in Quality Starts, stopping just 88.8% of shots.
Goalie           GS QS   QS%  ESSV%
Miikka Kiprusoff 52 32  61.5%  .928
Leland Irving     5  4  80.0%  .922
Henrik Karlsson   5  1  20.0%  .906
And that’s how it looks at the trade deadline. Will we see someone pick up UFAs like Cory Sarich, Scott Hannan, Tim Jackman, Tom Kostopoulos, or even Lee Stempniak and Olli Jokinen? How about Matt Stajan or Anton Babchuk? Or will the tough week (and season-long underlying numbers) prove no dissuasion for Jay Feaster, and we’ll see Backlund and picks sent away for a middling veteran with a questionable contract? Chances are we’ll see neither.
And a serious response to Kenta’s point – who ever suggested stats replace anything? I’ve never heard such an assertion from any statistical hockey analyst, neither here nor anywhere else, and yet we keep hearing this specific criticism.
In fact, we explicitly introduced this year’s new statistical segment to “supplement your subjective observations.” Supplement. Not replace. If you’d rather enjoy the greater number of surprises that comes with a less balanced and less complete understanding of the sport, that’s terrific. Using only one subjective analysis seem as silly to us as using only objective analysis seems to you (except that no one actually does that). And as we also said in our introduction last September:
“And for those of you who think this approach to hockey is a bunch of crap that provides absolutely nothing of value – don’t worry. We will stay off your lawn.”
Recent articles from Robert Vollman