Black Box: Week 25

12 years ago

Top lines dominated all year by their opponents in puck possession, shots, scoring chances and goals squandered a season with solid goaltending, good depth and improved special teams play. Unfortunately the exciting race for the final three post-season positions will have to manage without the Calgary Flames.
Team         1   2   3
Dallas      77% 76% 78%
Phoenix     66% 61% 63%
San Jose    58% 79% 53%
Los Angeles 66% 50% 62%
Colorado    26% 24% 37%
Calgary      7% 11%  7%
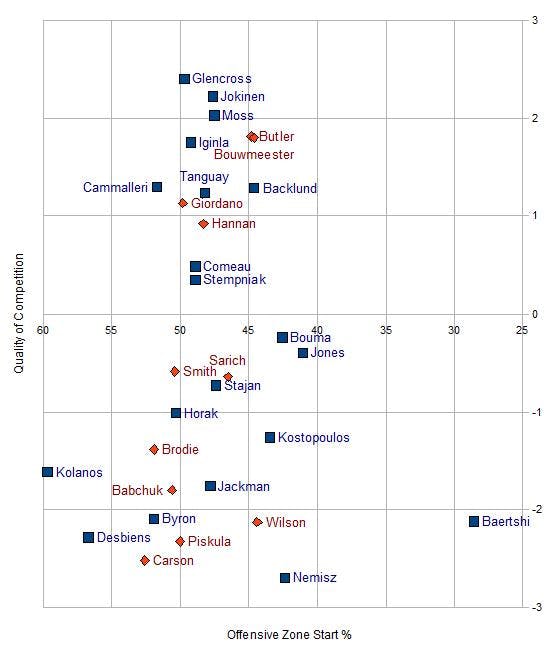
OZQoC Charts (explanation)
Even-Strength Scoring (explanation)
People may be surprised to see David Moss and Mikael Backlund listed among top-six forwards, but that’s how each of them have been used all season. Moss faces the 3rd toughest competition (behind Glencross and Jokinen), while Backlund faces the same level as Mike Cammalleri and Alex Tanguay, but does so starting in the offensive zone less often than anyone who faces above-average competition.
They have two other things in common – they’re the only ones winning the puck possession battle, and the only ones not making big bucks.
Top-Six Forward ESP/60 CEF CEA  CE% SCF SCA SC%   GF   GA    G%
David Moss        1.5   56  51 52.7% 12 15 44.2% 1.86 1.68  52.5%
Mikael Backlund   0.9   53  50 51.6% 16 14 51.7% 1.57 2.92  35.0%
Mike Cammalleri   1.7   49  54 47.3% 18 21 45.2% 2.39 2.82  45.9%
Curtis Glencross  2.3   48  57 45.7% 14 18 44.6% 2.77 3.06  47.5%
Alex Tanguay      2.2   49  58 45.7% 18 17 51.4% 2.95 2.38  55.3%
Olli Jokinen      1.9   48  59 45.0% 15 19 44.7% 2.97 2.97  50.0%
Jarome Iginla     2.1   48  60 44.8% 16 19 46.8% 2.72 2.86  48.7%
Here’s a look at Calgary’s ample supply of secondary forwards. They did a good job assembling depth players this year, which is good news for a team among the most heavily hit by injuries.
3rd Line Forward ESP/60 CEF CEA  CE% SCF SCA SC%   GF   GA    G%
Lee Stempniak     1.7   54  50 52.0% 16 14 52.6% 2.42 2.68  47.5%
Blake Comeau      0.8   50  51 49.6% 13 15 46.8% 1.13 2.14  34.6%
Matt Stajan       1.4   50  51 49.6% 13 14 49.5% 1.76 2.54  40.9%
Blair Jones       0.8   45  51 46.9% 17 18 48.8% 1.01 1.68  37.5%
Roman Horak       1.1   41  51 44.7% 12 11 51.6% 1.85 1.54  54.6%
Lance Bouma       0.8   43  55 43.5% 12 12 50.5% 0.75 2.01  27.2%
That’s right, Sven Baertschi’s at the bottom, right above Raitis Ivanans. Please don’t send me hate mail, because I can explain: he started in the offensive zone less than 30% of the time – no one else was below Blair Jones’ 41%.
Depth Forward  ESP/60 CEF CEA  CE% SCF SCA SC%   GF   GA    G%
Krys Kolanos     0.5   54  49 52.5% 11 10 53.7% 1.04 1.57  39.8%
Greg Nemisz      0.0   44  43 50.5% 10 11 48.0% 2.61 1.74  60.0%
Tim Jackman      0.7   49  49 50.2% 11 12 48.5% 0.79 2.58  23.4%
Tom Kostopoulos  0.7   49  53 48.1% 12 13 47.1% 1.47 2.58  36.3%
G. Desbiens      0.0   34  45 43.0%  7  7 50.0% 0.00 0.84   0.0%
P-L. Leblond     0.0   46  58 43.9%  8 12 40.0% 4.16 0.00 100.0%
Paul Byron       1.1   35  51 41.1% 11 11 51.3% 1.63 0.54  75.1%
Sven Baertshi    3.5   31  48 38.8% 12 15 43.5% 3.52 1.17  75.1%
Raitis Ivanans   0.0   27  65 29.4%  5 27 16.7% 0.00 5.41   0.0%
A look at the blue line, and Calgary’s top four. Scott Hannan struggled at even-strength this year, other than that there doesn’t seem to be a difference who plays.
Top-4 Defense  ESP/60 CEF CEA  CE% SCF SCA SC%   GF   GA    G%
Mark Giordano    0.9   48  56 46.5% 14 16 46.0% 2.48 2.42  50.6%
Chris Butler     0.6   49  57 46.3% 16 18 47.7% 2.35 2.40  49.5%
Jay Bouwmeester  0.5   48  56 46.1% 15 17 46.3% 1.92 2.41  44.3%
Scott Hannan     0.5   44  57 43.8% 13 18 42.5% 2.34 2.83  45.3%
Anton Babchuk had another great week! Seriously, he’s really been rolling lately. Over-all his season numbers could be described as “not impressive” but that’s an upgrade from “absolutely terrible.”
Depth Defense  ESP/60 CEF CEA  CE% SCF SCA SC%   GF   GA    G%
Brett Carson     0.0   70  41 63.4% 19 11 63.6% 0.00 5.41   0.0%
T.J. Brodie      0.6   50  47 51.5% 15 13 53.3% 2.40 2.02  54.3%
Cory Sarich      0.4   48  48 50.1% 13 12 52.0% 1.70 1.78  48.9%
Clay Wilson      0.0   46  48 49.1% 12 14 46.7% 0.00 1.70   0.0%
Derek Smith      0.6   49  53 48.1% 15 13 53.5% 2.00 2.27  46.8%
Joe Piskula      0.0   50  59 45.9% 19 14 56.7% 0.00 5.54   0.0%
Anton Babchuk    1.0   47  56 45.4% 11 15 43.0% 1.96 2.15  47.7%
Special teams (explanation)
Olli Jokinen caught Curtis Glencross, to lead the team in power play scoring rate yet again.
Primary Forwards    TOI/GP PTS/60 CE/60
Mike Cammalleri      2.9     2.7   93.8
Jarome Iginla        3.2     3.9   79.9
Alex Tanguay         3.1     4.5   79.9
Olli Jokinen         3.0     5.5   79.0
Lee Stempniak picked up a power play point this week. For those who may be curious, the Flames had 104 shots per 60 minutes in Sven Baertschi’s limited look-see, 2nd among forwards only to Matt Stajan’s 107.8, in equally limited ice-time.
Secondary Forwards  TOI/GP PTS/60 CE/60
Mikael Backlund      1.1     3.9   85.0
David Moss           1.0     0.0   84.9
Lee Stempniak        1.8     2.4   82.6
Blair Jones          0.7     2.2   73.5
Blake Comeau         0.7     0.0   70.1
Krys Kolanos         1.0     0.0   68.4
Curtis Glencross     2.0     5.4   64.7
Clay Wilson got another game, and actually increased his already impressive on-ice shot total. I know this is a small sample size, but he might be worth a look on a team desperate for power play assistance. Speaking of which, Anton Babchuk had a great week too, but it was Jay Bouwmeester and Chris Butler who got points.
Defensemen          TOI/GP PTS/60 CE/60
Clay Wilson          2.5     0.0  151.0
Anton Babchuk        1.9     2.4  105.8
Jay Bouwmeester      2.2     3.6   80.7
Chris Butler         0.7     3.9   77.4
Mark Giordano        3.2     2.8   76.0
T.J. Brodie          1.7     3.9   68.0
Derek Smith          1.0     5.1   65.8
Penalty killing
From 21st to 10th, Calgary had a much improved power play this year, thanks in small part to the acquisition of Lee Stempniak, who returned from injury.
Primary Forwards TOI/GP CE/60
Lee Stempniak     1.7    75.5
Blake Comeau      1.3    80.1
Curtis Glencross  2.1    82.7
Alex Tanguay      1.3    86.8
Tom Kostopoulos   1.5    89.6
David Moss        1.4   108.7
Calgary has quite the rotation of penalty killers, here are the other players who have been used to at least some extent – I still say Mike Cammalleri is worth a much closer look next year.
Depth Forwards   TOI/GP CE/60
Mike Cammalleri   0.7    68.7
Blair Jones       0.6    85.1
Mikael Backlund   1.0    90.5
Olli Jokinen      0.4    94.1
Matt Stajan       1.0   116.2
Lance Bouma       0.4   128.3
Killing penalties was Scott Hannan’s primary contribution this year, earning his discount contract with his fine play.
Defensemen       TOI/GP CE/60
Scott Hannan      2.7    84.5
Mark Giordano     2.1    85.4
Jay Bouwmeester   3.2    92.3
Chris Butler      2.2    93.8
Cory Sarich       0.8    96.8
Goaltending (explanation)
Miikka Kiprusoff got all four starts this week, and gave Calgary a great chance to win three of them – he stopped only 16 of 19 against Dallas at week’s end. Nevertheless the team walked away without a single W (except the one on Jay Bouwmeester’s jersey).
Goalie           GS QS   QS%  ESSV%
Miikka Kiprusoff 64 40  62.5%  .929
Leland Irving     7  5  71.4%  .911
Henrik Karlsson   5  1  20.0%  .906
If Calgary wins all six remaining games they’ll finish with 95 points, a total that would have left them out of the post-season last year, and offers only a slim chance of a berth this year. I’d say it was all over but the crying, but I’m pretty sure the crying is over now too.
Recent articles from Robert Vollman