Flames in seven games: 4-2-1 in season’s second segment

By Ari Yanover
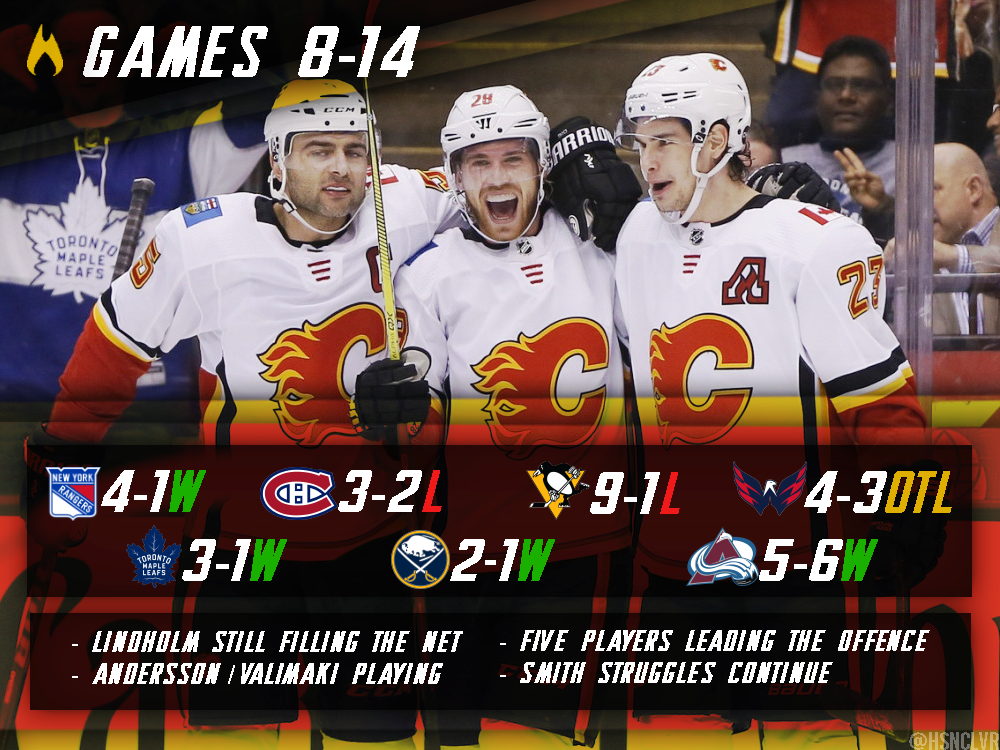
5 years agoGood news: in their first seven-game segment, the Flames were 4-3-0. This time around, they’ve improved by one whole point, to 4-2-1. Featuring one of their worst losses in years (decades?), they still came away with a great record: and looked good most of the time, too.
All underlying numbers via Corsica.
Team stats
Now up to an 8-5-1 record, the Flames are starting to look like they mean business. They have a .607 winning percentage through the season so far, up from their previous .571. It has them 12th in the NHL, sixth in the Western Conference, and second in the Pacific Division.
- Their goals for per game is 3.36, down from their earlier 3.71. They’re ninth overall in the NHL, fourth among Western Conference teams, and first in the Pacific Division.
- Their goals against per game is 3.29, exactly the same as it was after their first seven games. It’s 21st in the NHL, 12th among Western Conference teams, and second last in the Pacific Divison.
- Their goal differential is zero, down from +3. It has them tied for 16th in the NHL. They’re tied for eighth among Western Conference teams, and fourth in the Pacific Division.
- Their powerplay is at 15.8%, down from their earlier 19.4%. It’s 21st in the NHL. They’re 10th in the Western Conference, and fifth in the Pacific Division.
- Their penalty kill is at 71.7%, down from their earlier 81.5%. It’s 27th in the NHL. They’re last in the Western Conference and Pacific Division.
- At 8:42 penalty minutes per game, they’ve reduced the number of infractions they taken, down from 9:00 earlier. The Flames are 20th in most penalties in the NHL. They’ve taken the eighth most penalties per game in the Western Conference, and fourth most among Pacific Division teams.
- Their 5v5 CF/60 is 62.88, just down from 64.86. It’s the sixth highest in the NHL, fifth among Western Conference teams, and fourth in the Pacific Division.
- Their 5v5 CA/60 is 54.06, up a little from their previous 51.51. It’s the ninth lowest in the NHL, fourth lowest among Western Conference teams, and third lowest in the Pacific Division.
- Their 5v5 CF is 53.77%, a little bit down from their earlier 55.74%. It’s fifth highest in the NHL, and third among Western Conference and Pacific Division teams.
- Their 5v5 shooting percentage is 8.68%, down from 9.09%. It’s 14th in the NHL.
- Their 5v5 save percentage is 91.45%, up from 90.26%. It’s 19th in the NHL.
- Their PDO is 100.13, up from 99.35. It’s 16th in the NHL.
So, what’s changed?
The Flames are still scoring a lot of goals, but still allowing a lot, as well. Their special teams have declined, and are among the worst in the NHL. They’ve taken slightly fewer penalties, which helps offset that, but there are clear areas for improvement.
The Flames are still one of the top teams in the NHL when it comes to generating corsi events, and in terms of differential. They’ve gotten a bit more positive fortune over these past seven games as well: though their shooting percentage has dropped, they’re still scoring plenty; and their save percentage has improved some, David Rittich starting three of the seven games probably playing a role in that.
Player stats
First, the forwards (all situations, ordered by ice time).
Game scores courtesy of our very own Ryan Pike: 0.950 and above is considered great; 0.450-0.950 good; 0.150-0.450 fine; -0.150-0.150 bad; under -0.150 awful.
| Player | TOI | Goals | Points | P/60 | SH% | CF% | GF% | ZSR | Game score |
| Lindholm | 288.72 | 9 | 14 | 2.49 | 24.32 | 56.38 | 52.38 | 55.42 | +1.055 |
| Gaudreau | 288.72 | 6 | 17 | 3.12 | 13.95 | 60.56 | 60.00 | 68.10 | +1.191 |
| Monahan | 281.03 | 6 | 16 | 2.56 | 17.14 | 60.04 | 60.98 | 69.77 | +1.059 |
| Backlund | 256.98 | 2 | 8 | 1.63 | 6.90 | 58.06 | 53.85 | 49.48 | +0.834 |
| Tkachuk | 251.98 | 5 | 17 | 4.05 | 16.13 | 65.41 | 67.65 | 69.07 | +1.177 |
| Neal | 220.82 | 2 | 3 | 0.82 | 6.06 | 58.29 | 42.11 | 60.00 | +0.390 |
| Bennett | 176.33 | 2 | 3 | 1.02 | 9.52 | 51.87 | 43.75 | 52.81 | +0.353 |
| Ryan | 170.00 | 1 | 3 | 0.71 | 12.50 | 51.04 | 41.67 | 47.71 | +0.249 |
| Frolik | 157.90 | 6 | 6 | 2.28 | 28.57 | 48.94 | 50.00 | 54.17 | +0.547 |
| Dube | 143.90 | 0 | 2 | 0.83 | 0 | 50.95 | 50.00 | 53.33 | +0.272 |
| Jankowski | 107.22 | 0 | 1 | 0.56 | 0 | 48.11 | 22.22 | 46.51 | +0.213 |
| Czarnik | 105.18 | 1 | 3 | 1.71 | 6.67 | 62.09 | 37.50 | 62.12 | +0.693 |
| Hathaway | 93.97 | 2 | 2 | 1.28 | 25.00 | 45.68 | 60.00 | 51.35 | +0.180 |
| Peulso | 9.65 | 0 | 0 | 0 | 0 | 60.00 | n/a | 50.00 | +0.188 |
Now with 14 games’ worth of data, slightly clearer pictures are forming. There’s been some shuffling amongst the bottom forwards, but the top five guys have remained relatively consistent, and have been performing a cut above the rest. There’s some debate as to who the sixth forward actually is – most recently it’s been Michael Frolik, but Austin Czarnik’s numbers imply that, at the very least, he probably shouldn’t be a healthy scratch so often.
Elias Lindholm has jumped up to get roughly the same amount of ice time as Johnny Gaudreau, while Sam Bennett has leapfrogged Derek Ryan (deservedly so, based on their numbers), and Czarnik’s frequent healthy scratches have seen Frolik, Dillon Dube, and Mark Jankowski jump over him (perhaps undeservedly, though that all six of Frolik’s points are goals – he’s tied for second in team goal-scoring – is a little nuts and probably unsustainable).
Speaking of unsustainable, Lindholm’s shooting percentage is still rather high as well, but the rest are falling into relatively stable numbers.
Tkachuk might even remain somewhat underplayed.
Mikael Backlund, Ryan, and Jankowski are the only forwards with consistent sub-.500 offensive zone start ratios: all centres. Backlund is easily the best of the three, though Ryan is managing as well (except on the offensive end of things). Frolik, Jankowski and Garnet Hathaway are the only Flames forwards with corsi percentages under 50 through 14 games, while some of James Neal and Bennett’s bad luck shows in their sub-50% goals for ratings.
The Flames’ most common line combinations at 5v5 have been:
| Gaudreau | Monahan | Lindholm |
| Tkachuk | Backlund | Frolik |
| Tkachuk | Backlund | Czarnik |
This is unchanged from the first seven games, though the Bennett – Jankowski – Neal line is closing in.
Now, the defence (all situations, ordered by ice time):
| Player | TOI | Goals | Points | P/60 | SH% | CF% | GF% | ZSR | Game score |
| Giordano | 350.05 | 2 | 15 | 2.40 | 4.35 | 58.39 | 64.44 | 53.45 | +1.329 |
| Brodie | 301.67 | 0 | 4 | 0.99 | 0 | 51.72 | 51.61 | 51.39 | +0.555 |
| Hanifin | 284.25 | 0 | 3 | 0.63 | 0 | 52.79 | 45.83 | 46.15 | +0.413 |
| Valimaki | 192.97 | 1 | 2 | 0.62 | 8.33 | 48.15 | 27.78 | 66.35 | +0.219 |
| Andersson | 189.35 | 0 | 1 | 0.32 | 0 | 47.51 | 55.56 | 57.66 | +0.244 |
| Stone | 161.18 | 0 | 4 | 1.49 | 0 | 47.25 | 35.00 | 49.51 | +0.355 |
| Hamonic | 112.73 | 1 | 1 | 0.53 | 10.00 | 53.42 | 33.33 | 39.39 | +0.708 |
| Prout | 13.75 | 0 | 0 | 0 | 0 | 60.00 | 33.33 | 50.00 | +0.225 |
With Travis Hamonic back in the lineup and neither Juuso Valimaki nor Rasmus Andersson worthy of being scratched or demoted, Michael Stone has found himself relegated to the sidelines. Hamonic has helped improve the Flames’ defence, while Valimaki and Andersson are experiencing growing pains – but they’re starting to come along (Andersson in particular, while Valimaki’s overall numbers have dropped off some).
Mark Giordano is still clearly far and away the best of the group, though, while Noah Hanifin has seen some improvement.
But for real… the defence is pretty much all Giordano. It’s difficult to see that changing, but it will be interesting to see how the group comes along over the third set of seven games, now that they’re at their ideal six – and that the rookies are getting more and more experience and starting to get chances to show off.
And finally, goalies (all situations):
| Player | TOI | SV% | ldSV% | mdSV% | hdSV% | Game score |
| Smith | 549.95 | 87.12 | 95.05 | 86.67 | 76.71 | -0.250 |
| Rittich | 288.73 | 93.87 | 98.28 | 92.19 | 90.24 | +1.300 |
Rittich has been getting more ice time, and his numbers have held steady (or, in the case of high danger saves, shot up by quite a bit), while Mike Smith continues to flounder, suffering mild decreases at best and no improvements in his numbers. He’s also the only Flame with a negative game score through 14 games; in contrast, Rittich appears increasingly valuable – though he’s still an unknown, as we don’t know how well he’d fare with an increased workload.
But it probably wouldn’t hurt to find out.
Recent articles from Ari Yanover


