
Flames Player Usage Charts

By Kent Wilson
11 years ago
We’re only about half way through Hartley’s first 10-game segment as the Flames coach so we’re limited in how much we can read into his bench management so far. That said, a few things seem to be emerging in the early going as mentioned yesterday, so let’s dive in and see how each guy has been deployed and how he has fared in that role.
Player Usage Charts – Introduction
These charts help visualize three primary elements in player evaluation:
1.) Zone starts, or the ratio of offensive zone to defensive zone faceoffs for each player.
2.) Quality if Competition, or who on the other team a player faces, be it first liners or fourth liners.
3.) Corsi, or the ratio of shots for and against the occur with the player on the ice.
Of course, all of the above is considered at even strength only.
These charts starting popping up in various forms a few years ago, but one of the main proponents and innovators was Hockey Prospectus (and part-time FN contributor) Rob Vollman. This chart was submitted by him.
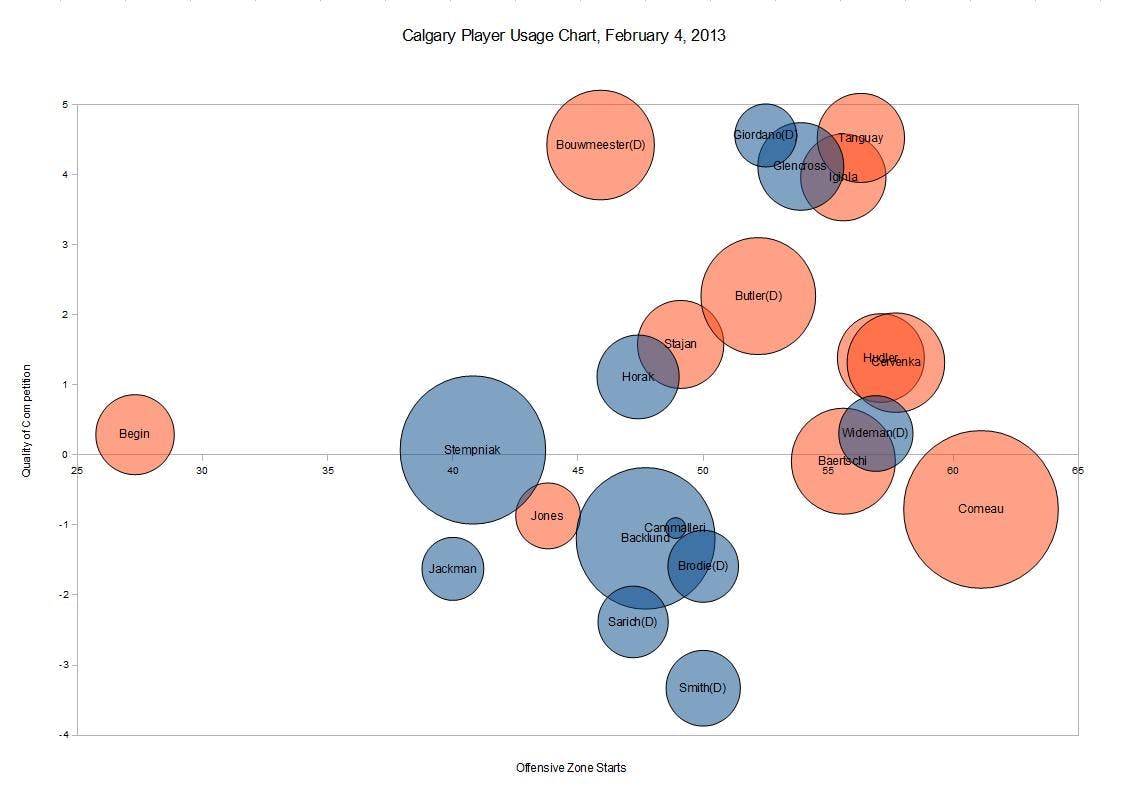
On the x-axis is the ratio of offensive zone draws moving from most difficult to easiest. On the y-axis is the quality of competition moving from easiest to toughest. So a guy in the upper left hand corner would be facing murders row and starting in the defensive zone all the time, while a guy in the bottom right would be facing 4th liners and starting in o-zone all night.
The color and size of each players "bubble" represents his relative corsi rate. Blue represents guys with positive ratios (above 0 or 50%) while red are players underwater (below zero or below 50%). Bigger bubbles means the player is further above or below neutral – so a big blue bubble means a high relative corsi while a big red bubble means a very low (negative) rate.
The ideal superstar plays against other players superstars, starts more often in his own zone and still has high possession numbers. Let’s call him "Davel Patsyuk". His big, blue bubble would be slightly left of Bouwmeester’s on this chart. An archetypal replacement level or worse player would look like…well Blake Comeau on this chart.
Discussion
As usual, given the sample size, we should take these numbers with a pinch of salt. Quality of competition metrics are especially prone to kicking out some odd results with so few games played (although the Flames positioning on this chart more or less matches what I’ve seen by eye so far).
In addition, Rob has used relative corsi here rather than absolute corsi for possession numbers which can be deceptive if not correctly noted. Jarome Iginla isn’t actually underwater on the season (he’s closer to even), but relative to the club’s performance his corsi rate is in the red. Ditto Hudler and Cervenka, who are actually well on the positive side of the ledger by normal corsi.
What obviously stands out is the work done by Stempniak and Backlund have done so far. They’ve started more often in the d-zone but lead the pack by wide a margin in terms of possession. They’ve mostly faced muffins so far, but it wouldn’t surprise me if Hartley starts match them a bit more against top-6 competition.
Jay Bouwmeester continues to face the toughest competition on the team and in the toughest circumstances. He hasn’t fared all that well so far, truth be told, although that defniitely has a lot to do with his struggles through the first few games. He and Giordano seem to have turned things around lately, so his results could improve as we move along.
As mentioned, Blake Comeau is playing butter soft minutes and getting killed. He was okay as a middle rotation winger last season (although he couldn’t put the puck in the ocean) but he has been legitimately terrible to start this season.
Other Stuff – Chicago Chances
I finally sat down and counted out the chances per line from the Chicago game. I limited it to even strength chances, although I can put together the PP chances per line if anyone would like as well.
Anyways, here’s how things broke down. The final numbers surprised me:
| Line | ES FOR | ES AGAINST |
|---|---|---|
| 13-40-12 | 4 | 4 |
| 10-18-24 | 4 | 3 |
| 11-20-22 | 14 | 2 |
| 15-19-17 | 1 | 2 |
| Total | 23 | 11 |
Essentially, each forward unit traded chances with their counterparts…except for the Backlund unit who went all medieval on the Hawks. A lot of the damage was done in that lopsided thrid period, no doubt when the Hawks legs were gone (and they were defending a lead) so attach appropriate caveats.
Guys like Iginla and Hudler were on the ice for a lot more chances overall because they featured prominently on the man advantage, but at ES they more or less just traded blows. Which isn’t, in itself all that bad given they were facing guys like Hossa, Toews and Kane most of the night. That said, Calgary’s overall domination was built on the back of it’s third line.
Recent articles from Kent Wilson


