Flames Scoring Chance Differentials – October

By Kent Wilson
13 years ago
This is a bit of a data dump post. Here I will present the even strength scoring chance numbers for individual Flames over their initial 11 games. There aren’t a lot of surprises for those who have been following along, although the numbers illuminate the relationship between scoring chances, possession and circumstances pretty well.
First, here’s the ES chances for and against for every skater thus far:
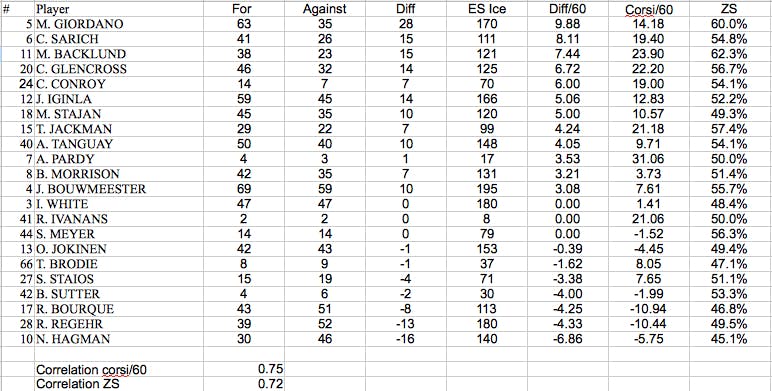
The columns are, in order: chances for, against, chance differential, ES ice time, chance differential per 60 minutes of ice, corsi rate/60 minutes of ice and zone start ratio (offensive-zone to defensive zone). The players are ordered from best differential/60 rate (Mark Giordano) to the worst (Nicklas Hagman).
Discussion:
– The Flames had an overall ES scoring chance ratio of 53% (+881, -775). That’s pretty healthy and accords with their decent overall outshooting during the month.
– By and large, the most sheltered players on the club in terms of starting position managed good differentials (Gio, Glencross, Backlund) while the guys with the toughest circumstances got eaten up (Regehr, Hagman, Bourque) with everyone else more or less falling in between.
– The Flames top line of Iginla, Tanguay and Stajan is certainly above water, which is (sort of) good news. Given the pay grade and expectations of that group, however, we’d hope they would be leading the charge since guys like Bourque and Hagman are being fed to the wolves to give them easier circumstances.
– Although he has one of the lowest scoring chance for per 60 minutes of ice rates on the team (about 16 per hour), Jokinen at least wasn’t completely destroyed over this span of games, which is actually an improvement relative to where he was last year at this time. It’s not "great", but given the circumstances, he hasn’t been a disaster. If Sutter continues to treat him like a checking pivot I would bet on things getting uglier for Jokinen going forward, but I guess we’ll see.
– It looks like Sutter has decided that Hagman and Bourque are the go-to "defensive" forwards (with Jokinen currently their center). They saw the toughest zone starts and they paid the price in terms of possession and scoring chances. Again, this is where a Daymond Langkow is valuable: when a guy can outperform his zone start ratio and post better than expected corsi and chance rates, it helps the team.
– Some folks are probably surprised by Morrison’s completely average results on this chart. Two things: one, he has the highest on ice percentages on the team so far, meaning lady luck has smiled upon him. Second of all, this is limited to ES. A couple of Morrison’s points have come on special teams.
– The correlations at the bottom of the chart are chance differential to corsi/60 rate (0.75) and chance differential to zone start ratio (0.72). Those are surprisingly solid given the small sample size.
Recent articles from Kent Wilson