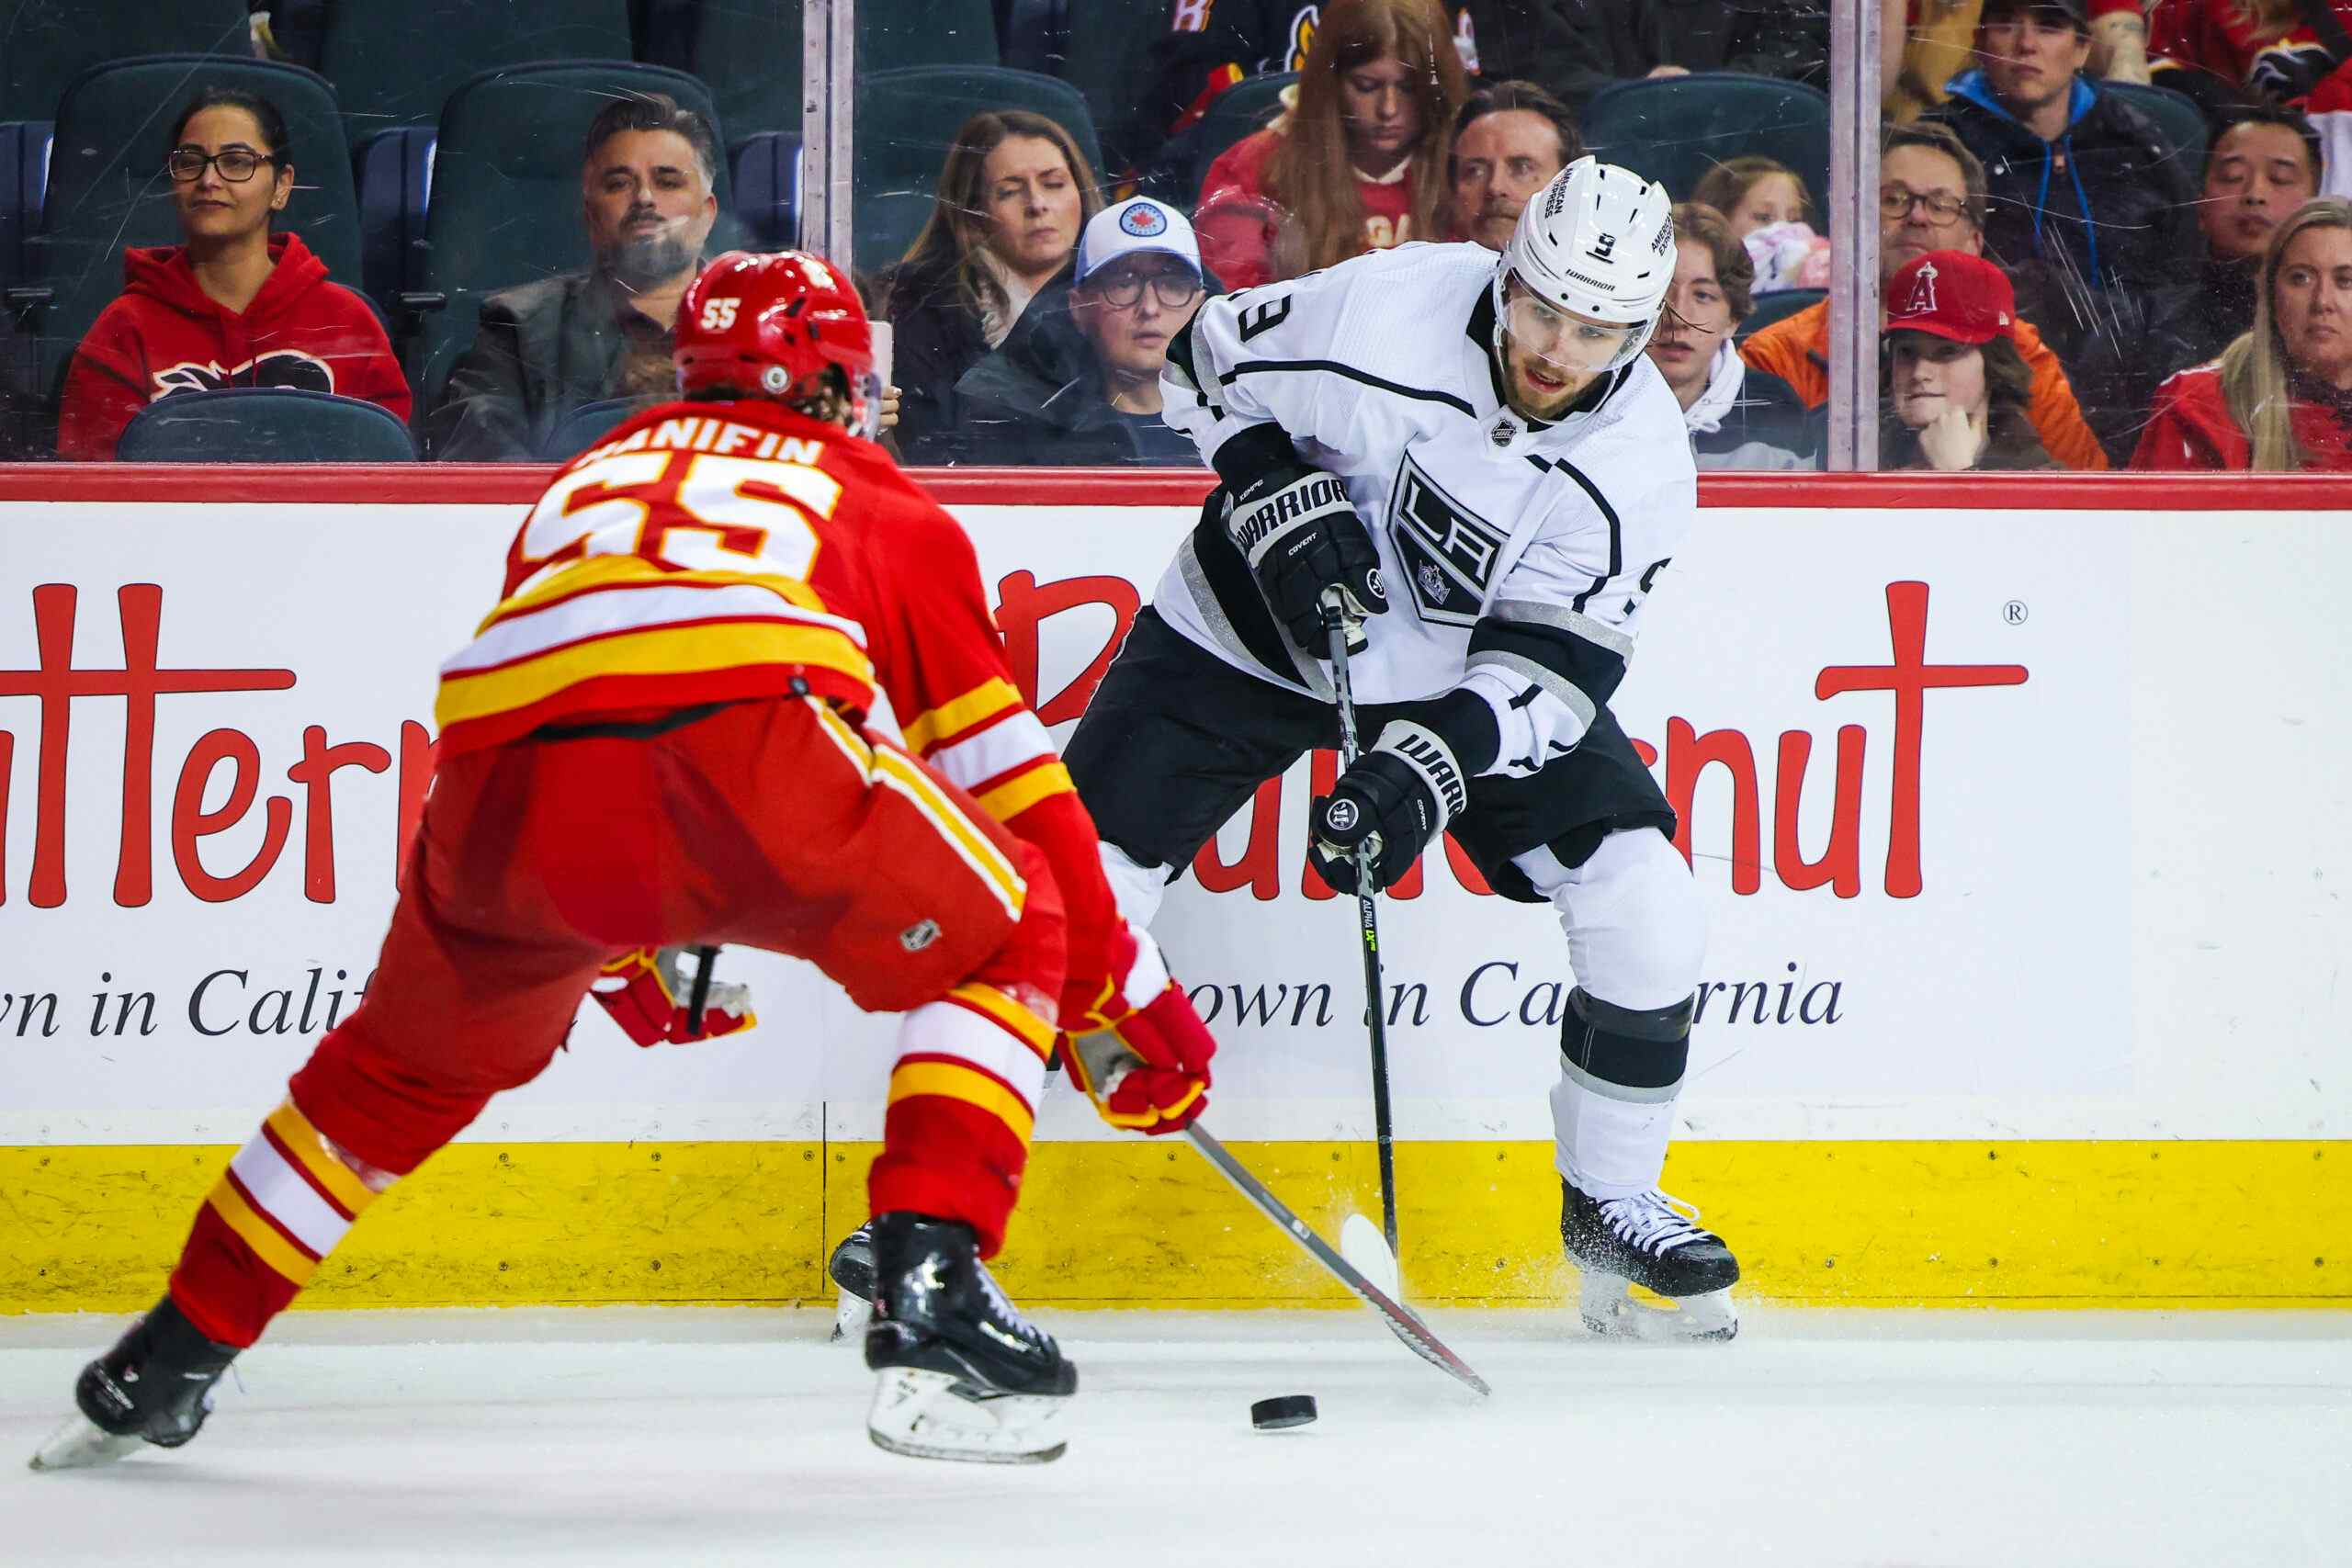
How do the Flames stack up against the California teams?

By Ari Yanover
5 years agoMore often than not as of late, it’s the California teams that have sat atop the Pacific Division, and been among the toughest tests others have had to face.
Though it’s early in the 2018-19 season, that hasn’t been the case so far: the Flames sit atop them all while the California teams have had their hiccups, ranging from “shouldn’t you be at the top, what gives” to “oh wow a -17 goal differential? The worst in the league? Yikes.”
Little will be solved over the coming week, but as the Flames embark on a three-game road trip through California, it should be a good test for them to measure just how well they’re really performing.
On Wednesday, the Flames face the Ducks. On Saturday, they take on the Kings. And then on Sunday, in a quick back-to-back scenario with geography a bit more distant than the usual Anaheim-Los Angeles proximity, they’ll play the Sharks.
As things stand heading into this roadie, the Flames rest atop the Pacific with 19 points in 15 games. The Sharks are just out of a wild card spot in the West, with 17 points in 14 games; the most they could do at this stage in time is tie the Flames. The Ducks and Kings are both out of playoff spots as well: the Ducks with 15 points in 15 games, and the Kings not just the worst in the West, but the worst in the NHL with only nine points in 13 games.
But that’s just a snapshot of the present-day standings. Underlying numbers such as corsi can work as predictors for how a team may fare in the future (i.e. are they due to score more any time now? Are they getting by on just the stellar performance of their goaltender?), and comparing the California teams’ numbers to the Flames’ can give us additional insight into how they may match up.
Table ordered by points percentage, underlying data via Corsica:
| Team | P% | 5v5 CF% | 5v5 GF% | 5v5 SH% | 5v5 SV% | PDO |
| Flames | .633 | 54.28 | 50.79 | 8.77 | 91.22 | 99.99 |
| Sharks | .607 | 58.64 | 45.61 | 6.37 | 89.49 | 95.86 |
| Ducks | .500 | 42.22 | 53.49 | 7.96 | 95.13 | 103.09 |
| Kings | .346 | 50.48 | 36.96 | 5.88 | 90.55 | 96.44 |
At a glance, we can see that everything seems to be in order for the Flames. Their goals for doesn’t quite match up with their corsi, so they maybe could be doing even a little better, but there’s nothing egregious about their results and the numbers that have gotten them there: this is a good team that’s being rewarded for its efforts.
The Sharks and the Kings, in contrast, appear to be unluckier. Neither team is seeing great shooting or save percentages, with the Kings in particular being badly hurt by the way things are going (barely scoring and bleeding goals against will do that, but it’s possible they could experience a turnaround; at the very least, they probably shouldn’t be this bad). The Sharks will probably be as dangerous as ever though as the early season sorts itself out, and they’ll likely be the most threatening California team.
The Ducks, meanwhile, have John Gibson and his .935 save percentage to thank for being a .500 team (and Ryan Miller, in a backup role, has also helped, with a .932% effort of his own). A decent shooting percentage is helping out as well, but they’re a candidate to fall further away from the pack rather than remain a part of it.
Then, there’s special teams:
| Team | PP% | PK% |
| Flames | 16.7 | 72.0 |
| Sharks | 21.3 | 87.8 |
| Ducks | 17.1 | 81.1 |
| Kings | 14.9 | 81.1 |
The Flames’ special teams absolutely have to be better, though we already knew this. While their powerplay isn’t too bad compared to their California brethren (though you’d think it would be better considering their raw offensive potential), the penalty kill needs to be significantly better. Special teams could prove costly through this road trip if these numbers hold to truth.
Recent articles from Ari Yanover


