Season Preview: Explaining the Flames Power Play Improvement

By Kent Wilson
12 years ago
(One sometimes overlooked aspect of the Flames big turn around last year was their improvement on the man advantage. The club went from bottom-third to top-10 very rapidly. I asked JaredL of the excellent analytic blog Driving Play to investigate whether that improvement was due to luck, ability or circumstance and what it might portend for this year. This is what he found)
By: JaredL
Kent asked me to step away from my usual home at Driving Play to write an article on the Flames’ improvement on the power play last season. Analyzing special teams is a tricky business, much more so than even-strength play. The sample sizes are drastically smaller; the Flames averaged over 49 minutes per game at even strength compared to about 6:25 on the power play and 5:42 killing penalties. They are also irregular – one game you might be on the power play just once and another you might get 10 opportunities. Despite all that, we can use shooting stats to get some insight into what was going on out there.
A Tale of Two Halves
The Flames’ power play struggled early on and steadily improved over the season. Here is a graph of their power play percentage and their scoring rate on the power play, over the course of the season. You can see that they got better as the season went on, as shown by the general upward trend in the graphs.

There was a massive difference between the first and second half of the season. Here’s a table with their results by half:
| Half | Goals | PP% | PPG/60 mins |
| First | 25 | 0.152 | 5.692 |
| Second | 37 | 0.243 | 8.724 |
Possible Explanations
Here are some possible explanations:
1. They had more short or broken-up power plays in the first half, leading to a lower percentage.
2. They had more 5-on-3 power plays late in the season.
3. They faced tougher penalty-killing teams earlier in the season than late.
4. Later in the season they did better at getting setup in the offensive zone and dominating possession.
5. They created better shots and/or more of their shots went in as the season went on. Let’s look at these individually.
1. They had more short or broken-up power plays in the first half, leading to a lower percentage.
I eliminated this with the above table. Their rate went up in almost the same pattern as their power-play percentage, so it does not appear to be some fluke in the timing of power plays. While in theory PP% might be the most obviously flawed metric in sports, it does have a very strong correlation to scoring rate as you can see, so it’s fine to use in practice.
2. They had more 5-on-3 power plays late in the season.
This is pretty easy to reject. Here’s a table of 5-on-3 goals and opportunities in the two halves of the season:
| Half | Goals | Opportunities |
| First | 2 | 0.09 |
| Second | 4 | 0.06 |
3. They faced tougher penalty-killing teams earlier in the season than late.
It’s tough for the schedule to get drastically tougher over half of a season, but if Calgary faced a bunch of cupcakes late then that could lead to these results. This does not appear to be the case, in fact, it looks like the opposition was ever-so-slightly better on the penalty kill in the second half of the season. Here’s a table with the average penalty kill percentage of the Flames’ opponents in each half. The first column is the raw average, the second weighted by the number of chances Calgary had in the game:
| Half | Avg. PK% | Weighted Avg. PK% |
| First | 81.3% | 81.2% |
| Second | 81.4% | 81.8% |
Looking at their opponents’ PK% gives us another way to see the Flames’ improvement. Here are two line graphs, one for each half of the season, showing how Calgary fared compared to what their numbers would have been if they’d scored at the average percentage their opponents allowed:


Over the first half of the season, the Flames scored 6.07 goals below average when you take opponent PK% into account. That flipped in the second half – they had 9.3 more PP goals than average.
4. Later in the season they did better at getting setup in the offensive zone and dominating possession.
The standard way to measure possession and territorial dominance is Corsi stats. Corsi is like +/- but includes all types of shots – goals, saved shots, missed shots and blocked shots. Since we’re looking at the power play only, it might be useful to ignore the minus aspect and just look at all the shots the Flames generated. I call this +Corsi. Here is a table with their Corsi rate and +Corsi rate over each half of the season:
| Half | Corsi Rate | +Corsi Rate |
| First | 74.288 | 90.923 |
| Second | 78.810 | 94.855 |
As you can see, the Flames did improve in territorial dominance. They improved their overall Corsi by about 6% (4.3% if you focus only on their own shots). Using back-of-the envelope calculations, I estimate that about 1.3 goals of their second-half improvement is due to bettering their +Corsi.
5. They created better shots and/or more of their shots went in as the season went on.
First let’s focus on the second part. The main reason that the Flames improved so much was that a higher percentage of their shots hit the back of the net. Here is a table with their goals, shots and shooting percentage for each half:
| Half | Goals | Shots | Shooting% |
| First | 25 | 208 | 12.0% |
| Second | 37 | 218 | 17.1% |
Both halves were more extreme than their best and worst PP shooting percentages for all seasons since the lockout. It’s pretty clear that luck played a big role on both sides – the Flames were unlucky to shoot so poorly in the first half of the season and fortunate to shoot so well in the second. Did they create better shots, though? There is some evidence of that. While exact shot location would be better, a decent, and much quicker, way to look at the quality of shots is to look at distance. Here is a table breaking down the number of shots, including missed shots, they took from each distance range:
| Distance (ft.) | 1st Half | 2nd Half |
| 0-10 | 29 | 33 |
| 11-15 | 33 | 39 |
| 16-20 | 21 | 25 |
| 20-25 | 16 | 25 |
| 26-30 | 21 | 22 |
| 31-35 | 20 | 20 |
| 36-40 | 32 | 20 |
| 41-45 | 23 | 36 |
| 46-50 | 33 | 35 |
| 51-55 | 29 | 23 |
| 56-60 | 21 | 31 |
| >60 | 12 | 8 |
| Total | 290 | 317 |
And here that is in bar-chart form:
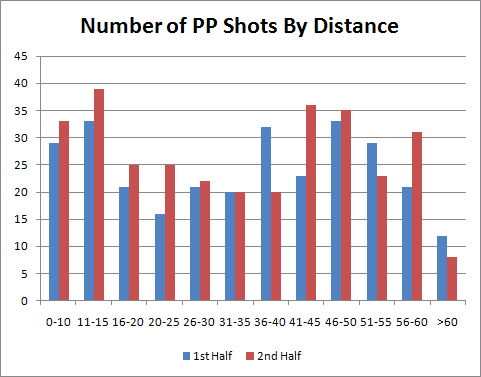
You can see that they did a much better job getting into dangerous areas for their shots. The Flames took 27 more shots on the power play in the second half of the season and an impressive 24 of those extra shots were from inside of 30 feet. While I think most of their improvement came down to luck, given that a higher percentage of their shots came from closer range it’s clear that they were getting better shots and that was responsible for part of their improved shooting percentage.
What does that mean for 2011-2012?
Power Play performance is tough to analyze and tougher still to predict. The good news for Flames fans is that things definitely went the right direction and it wasn’t all luck. It’s clear that Calgary was on the wrong side of the bounces earlier on and were overly fortunate later. I don’t expect the Flames to shoot quite as high a percentage as they did but they should still be one of the better teams on the power play. Somewhere around 10th in PP% seems reasonable if they can continue to sustain their second half shot rates and such.
(Thanks again to JaredL for doing such great work. Check out Driving Play for similar quality quantatitive analysis.)
Recent articles from Kent Wilson