The Flames probably did receive revenue sharing last season

By Ryan Pike
6 years agoLast week, Calgary Flames president Ken King spoke about the business of hockey at an event hosted by the Chamber of Commerce – taking great pains to avoid speaking much about the arena project, which is dead. One interesting piece of information was divulged by King at the luncheon: he claims the Flames received revenue sharing last year.
We took a dive into the Collective Bargaining Agreement and the best guesses we have for hockey-related revenue and arena expenses. Given the parameters of the revenue-sharing program used by the 30 National Hockey League clubs, King’s claim is actually fairly credible.
It’s probably worth going into a bit of an explanation of how the NHL’s revenue-sharing program works. It’s detailed in Section 49 of the CBA, but their explanation is a bit complex and frustratingly circular. The Hockey News’ Ken Campbell had a bit of a better explanation, so let’s see what he said:
Teams receive revenue sharing if they qualify for it under the terms of the collective bargaining agreement. One NHL executive said that, generally speaking, the way NHL revenue sharing works is that the teams that finish in the top 10 in revenues share some of those revenues with the teams that finish from 11 through 31. This isn’t always the case, but it appears to be a general rule. He said the Flames will not have finished in the top 10 in 2016-17 and are not in the bottom 10 either. That means they will receive somewhere in the neighbourhood of $1 million-$2 million at the upper end and $10 million-$12 million if they are down around 20.
At its core, the idea of the revenue-sharing program is to balance out the hockey-related revenues with the hockey-related expenses. Within Section 49, hockey-related expenses are branded as “arena expenses” which presumably include things like maintenance and player salaries. (It’s a bit unclear within the CBA specifically how things fit into hockey-related expenses, though.)
Since we don’t have the NHL’s actual revenue-sharing numbers, let’s try using the numbers that we do have to illustrate the general revenue and cost picture league-wide. For revenues, I’m using the Forbes projections from their 2016 team valuations. Since their revenue projections are from November 2016, I’m also using Cap Friendly’s 2015-16 cap hits to provide as close to an apples-to-apples comparison – going as close as we can to comparing 2015-16’s revenues with their most prominent expenses.
Neither numbers are likely to be perfect. But as an approximation to illustrate the Flames’ relative financial standing within the league, they’ll be good enough.
Since the player share of hockey-related revenues is 50%, we approximate the player share of each team’s revenues below, compare them to each team’s cap hit and then see the difference between each team’s cap hit and their player share. A positive number means the team is flush with cash, negative number means they’re probably looking for revenue-sharing from the league.
| Team | Revenue | Player Share | Cap Hit | Diff. |
| NYR | $219m | $109.5m | $71.3m | +$38.2m |
| MTL | $202m | $101.0m | $70.6m | +$30.4m |
| TOR | $186m | $93.0m | $71.3m | +$21.7m |
| PIT | $178m | $89.0m | $73.7m | +$15.3m |
| CHI | $173m | $86.5m | $71.4m | +$15.1m |
| BOS | $169m | $84.5m | $70.7m | +$13.8m |
| PHI | $160m | $80.0m | $70.6m | +$9.4m |
| VAN | $146m | $73.0m | $73.0m | $0.0m |
| DAL | $144m | $72.0m | $69.8m | +$2.2m |
| LAK | $142m | $71.0m | $71.9m | -$0.9m |
| SJS | $141m | $70.5m | $71.1m | -$0.6m |
| DET | $137m | $68.5m | $73.2m | -$4.7m |
| MIN | $136m | $68.0m | $70.8m | -$2.8m |
| WSH | $136m | $68.0m | $70.9m | -$2.9m |
| STL | $129m | $64.5m | $73.1m | -$8.6m |
| TBL | $127m | $63.5m | $73.3m | -$9.8m |
| NJD | $126m | $63.0m | $62.7m | +$0.3m |
| CGY | $121m | $60.5m | $69.0m | -$8.5m |
| ANA | $121m | $60.5m | $64.0m | -$3.5m |
| OTT | $118m | $59.0m | $65.0m | -$6.0m |
| EDM | $117m | $58.5m | $68.2m | -$9.7m |
| NSH | $116m | $58.0m | $62.0m | -$4.0m |
| BUF | $116m | $58.0m | $61.7m | -$3.7m |
| COL | $115m | $57.5m | $64.1m | -$6.6m |
| NYI | $114m | $57.0m | $66.3m | -$9.3m |
| WPG | $112m | $56.0m | $59.8m | -$3.8m |
| ARZ | $101m | $50.5m | $60.7m | -$10.2m |
| FLA | $100m | $50.0m | $67.5m | -$17.5m |
| CBJ | $100m | $50.0m | $68.0m | -$18.0m |
| CAR | $99m | $49.5m | $61.2m | -$11.7m |
In terms of revenue, based upon Forbes’ figures, the Flames are tied for 18th in the league. In terms of cap/revenue differential, they’re 22nd. This also discounts the possibility that maintenance costs on the ‘Dome – the third-oldest building in the league in 2015-16 – aren’t prohibitive by this point in the building’s life.
Oh, and also the Canadian dollar has crashed since 2013.
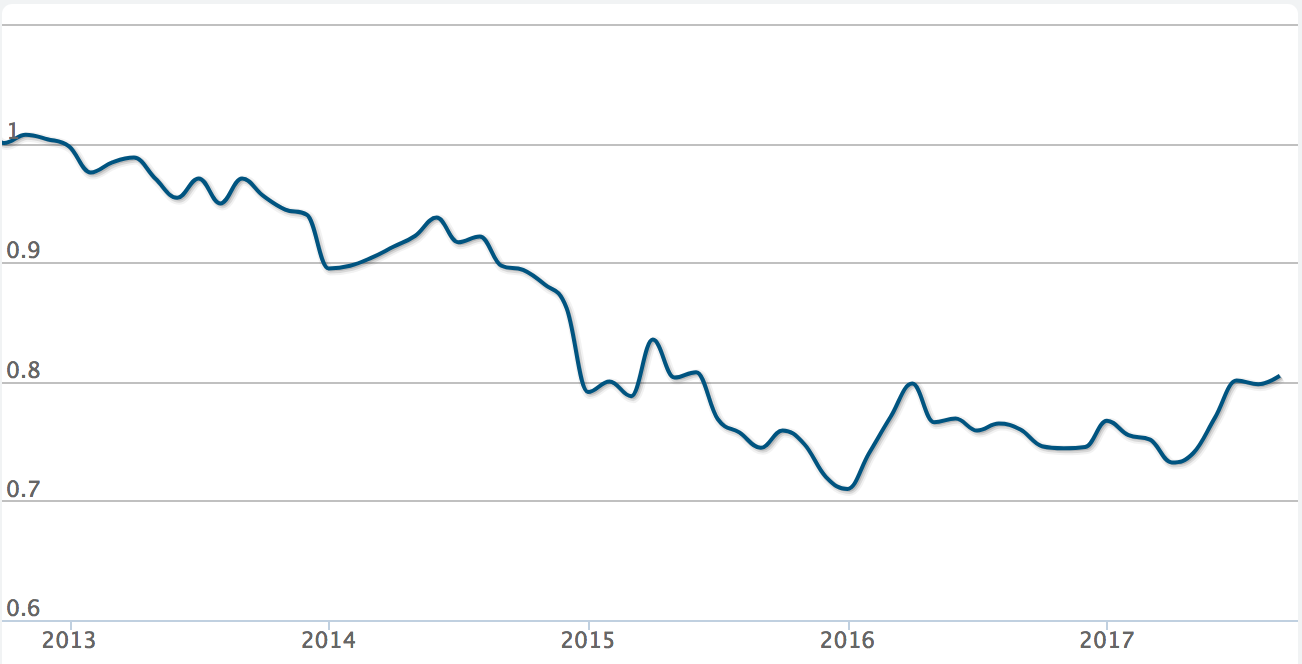
During the 2015-16 season the dollar was trading at around 75 cents, which would put the Flames’ 2015-16 revenues at around $150 million Canadian. When the dollar was stronger, the Flames were flirting with being a top 10 revenue team. With a weak dollar and a weaker Alberta economy, it’s no small wonder that the Flames’ financial standing isn’t quite as good relative to the rest of the league.
Is it a building issue? Sure! As far as I can discern, the Flames are on the hook for maintaining the Saddledome. After 34 years, that probably isn’t cheap. But the Flames’ drop into revenue-sharing territory is as much a large-scale economic issue – the drop in the world oil price taking its toll both on the Canadian dollar’s trading value and Calgary’s unemployment rate – as much as it is the ‘Dome being old and dusty.
Recent articles from Ryan Pike