
FlamesNation has no direct affiliation to the Calgary Flames, Calgary Sports and Entertainment, NHL, or NHLPA
Flames in seven games: 3-3-1 in second segment
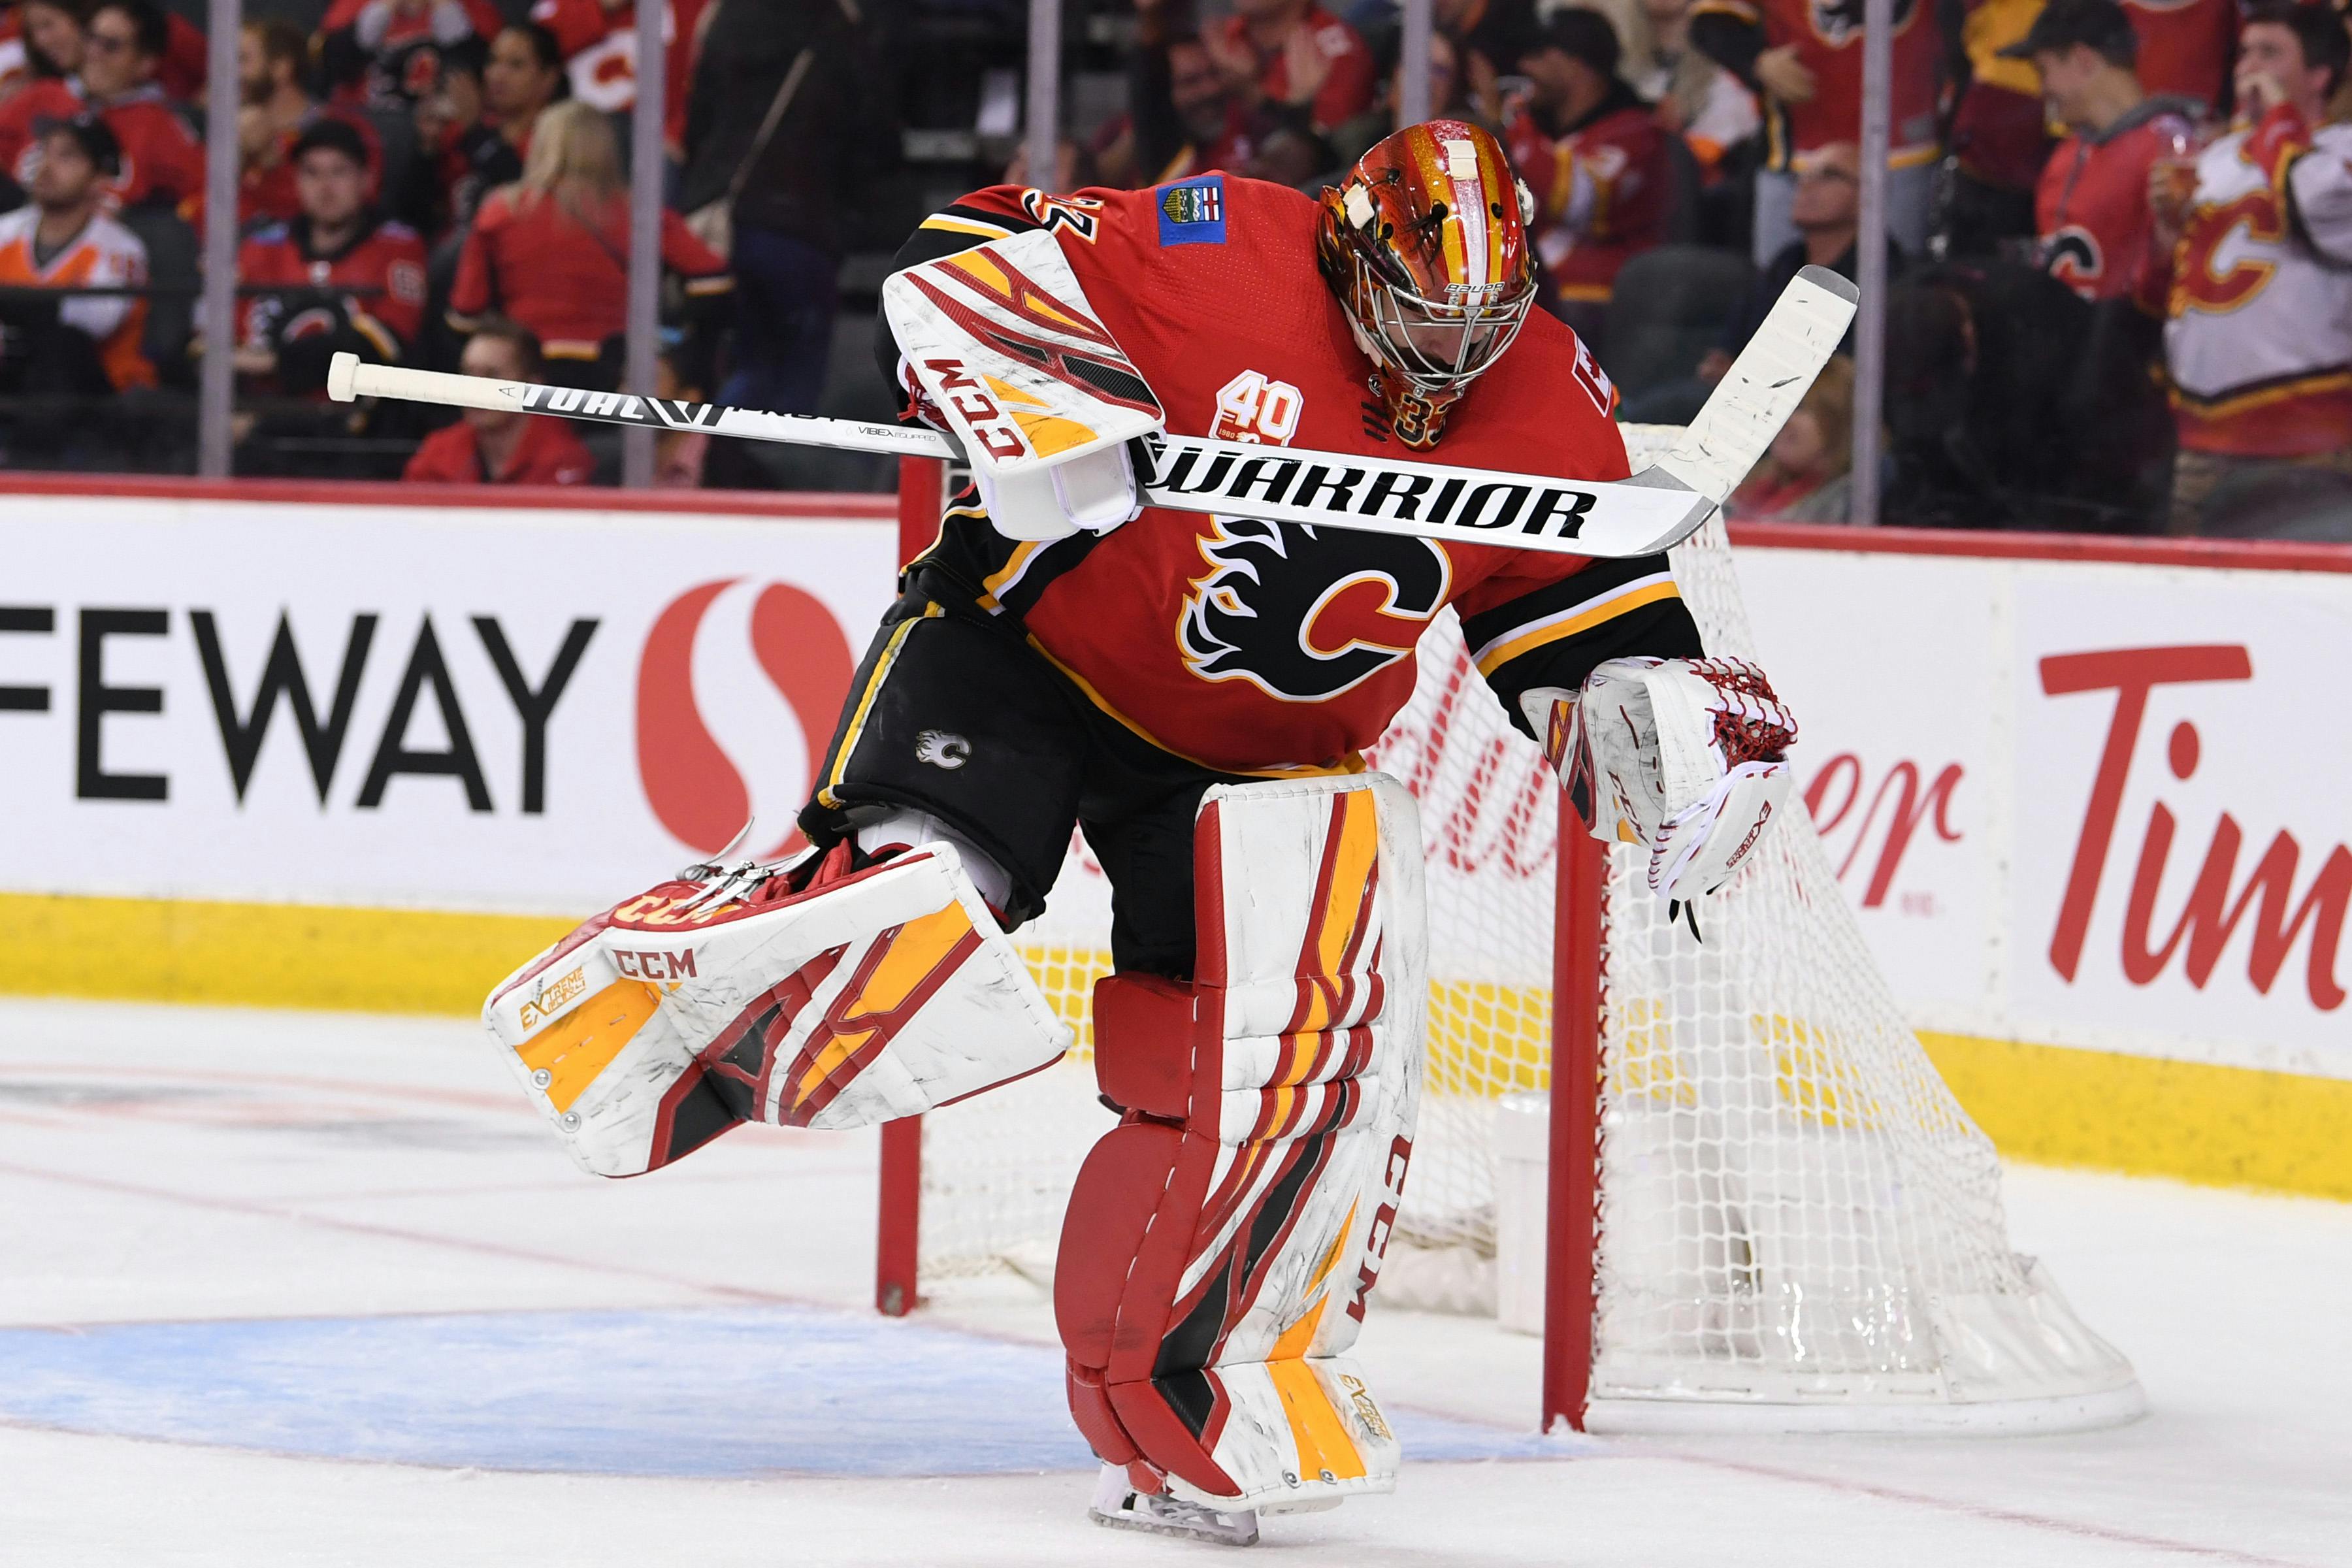
Photo credit: Candice Ward-USA TODAY Sports

The Calgary Flames have completed 14 games of the 2019-20 regular season calendar. They’re 17% of the way through their season, and so we continue the fine tradition of examining their performances in bite-sized seven game morsels. In the first seven games of this season, they went 3-3-1. In their second seven games, they went 3-3-1.
At least they’re consistent.
Underlying numbers via Natural Stat Trick.
Game by game
(Percentage stats in this table are 5v5.)
Date | Opponent | Result | CF% | SC% | HDSC% | PP | PK |
Oct. 17 | Red Wings (vs) | 5-1 W | 55.6 | 54.4 | 56.3 | 2-for-5 | 2-for-2 |
Oct. 19 | Kings (@) | 4-1 L | 50.7 | 50.0 | 42.9 | 0-for-5 | 7-for-8 |
Oct. 20 | Ducks (@) | 2-1 W | 52.4 | 48.1 | 38.1 | 0-for-0 | 3-for-3 |
Oct. 22 | Capitals (vs) | 5-3 L | 53.9 | 51.4 | 50.0 | 1-for-4 | 3-for-3 |
Oct. 24 | Panthers (vs) | 6-5 SOW | 51.4 | 45.7 | 50.0 | 1-for-3 | 2-for-2 |
Oct. 26 | Jets (@) | 2-1 OTL | 45.4 | 43.3 | 60.0 | 1-for-3 | 4-for-5 |
Oct. 29 | Hurricanes (@) | 2-1 L | 39.5 | 47.7 | 40.0 | 0-for-3 | 2-for-3 |
The Flames played three games at home (2-1-0) and four on the road (1-2-1).
Team stats
The Flames have a 6-6-2 record through their first seven games, the standings equivalent of a shrug (again). They have a .500 points percentage and haven’t really blown the doors down in any of their games to date. They have played three games – one against Vegas and two against Los Angeles – where you could argue they have had their doors blown completely off.
- Their goals for per game is 2.50, up from 2.43. They’re tied for 23rd overall in the NHL and 10th in the Western Conference.
- Their goals against per game is 2.93, down from 3.00. They’re tied for 14th in the NHL, and ninth in the Western Conference.
- Their goal differential is -4, down from -3. That puts them 20th in the NHL, and ninth in the Western Conference.
- Their power play is at 17.8%, up from 13.6%. It’s 21st in the NHL, and 10th in the Western Conference.
- Their penalty kill is at 86.8%, up from 85.2%. It’s tied for third in the NHL and in the Western Conference.
- They’ve taken 10:55 minutes of penalties per game, down from 11:40. That’s fifth in the NHL, and third in the Western Conference.
- Their 5v5 CF/60 is 58.05, down from 59.41. It’s the ninth highest in the NHL, and fifth among Western Conference teams.
- Their 5v5 CA/60 is 55.65, up from 54.14. It’s the 19th lowest in the NHL, and 11th lowest among Western Conference teams.
- Their 5v5 CF is 51.1%, down from 52.3%. It’s the 13th highest in the NHL, and sixth among Western Conference teams.
- Their 5v5 shooting percentage is 6.97%, up from 6.32%. It’s 26th in the NHL.
- Their 5v5 save percentage is 91.02%, up from 90.26%. It’s 22nd in the NHL.
- Their PDO is 0.980, up from 0.966. It’s 25th in the NHL.
Seven games ago, we said the Flames were okay. Now? They’re still okay! They haven’t really taken a big step forward, nor did they terribly regress. They’ve been fighting it in many of their games, but haven’t really taken on a ton of water.
At five on five, the Flames are a bit of a perimeter team but are still able to generate chances and shot events. Their challenges have been in their own end, as their tendency to get scored on early in games (and chase to try to tie things up) has led for their usual tight five-man formation to become elongated, gangly, and prone to turnovers and chances against.
Their power play is fine – neither good nor bad – though they’ve finally managed to get consistent zone time. Their penalty kill remains been pretty effective at shot and chance suppression, though it’s been one of the busiest in the NHL.
Player stats
First, the forwards (all situations, ordered by ice time).
Game scores: 0.950 and above is considered great; 0.450-0.950 good; 0.150-0.450 fine; -0.150-0.150 bad; under -0.150 awful.
Player | TOI | Goals | Points | P/60 | SH% | CF% | GF% | OZS% | Game score |
Lindholm | 272:25 | 8 | 10 | 2.20 | 22.9 | 58.2 | 57.1 | 55.1 | 0.788 |
Gaudreau | 271:16 | 3 | 11 | 2.43 | 7.9 | 60.4 | 64.0 | 67.8 | 0.889 |
Monahan | 255:13 | 2 | 8 | 1.88 | 5.1 | 56.9 | 61.5 | 63.3 | 0.598 |
Backlund | 254:58 | 2 | 4 | 0.94 | 6.3 | 49.2 | 40.7 | 56.3 | 0.421 |
Tkachuk | 249:10 | 4 | 10 | 2.41 | 10.3 | 59.4 | 54.8 | 68.6 | 0.804 |
Ryan | 199:36 | 1 | 5 | 1.50 | 5.3 | 39.9 | 56.3 | 42.3 | 0.232 |
Frolik | 178:28 | 1 | 3 | 1.01 | 7.7 | 45.9 | 21.1 | 50.5 | 0.141 |
Lucic | 178:01 | 0 | 3 | 1.01 | 0.0 | 56.1 | 41.7 | 60.4 | 0.181 |
Bennett | 157:49 | 2 | 3 | 1.14 | 10.5 | 49.5 | 55.6 | 51.9 | 0.224 |
Mangiapane | 133:52 | 2 | 4 | 1.79 | 10.1 | 50.6 | 57.1 | 46.3 | 0.433 |
Jankowski | 119:52 | 0 | 0 | 0.0 | 0.0 | 41.8 | 0.0 | 23.0 | 0.091 |
Rieder | 113:04 | 1 | 1 | 0.53 | 10.0 | 44.3 | 16.7 | 43.8 | 0.169 |
Czarnik | 81:03 | 2 | 3 | 2.21 | 22.2 | 54.6 | 75.0 | 58.9 | 0.394 |
Quine | 29:43 | 0 | 0 | 0.0 | 0.0 | 45.8 | n/a | 21.4 | 0.025 |
In a weird quirk, the only changes in the ice time order is Elias Lindholm overtaking Johnny Gaudreau and the addition of Alan Quine. Everyone else remains in the same order, which is a bit weird given that the Flames have been stuck in the NHL’s murky middle and haven’t found consistency. Bill Peters has shaken up the lines, but not the deployments – combinations are different, but zone starts and ice time are weirdly similar to seven games ago.
The Flames have a strongly defined top five – Gaudreau, Lindholm, Sean Monahan, Matthew Tkachuk and Mikael Backlund – and a fairly well-defined next three – Derek Ryan, Michael Frolik and Milan Lucic – and then a bunch of lineup chaos.
A lot of the Flames’ regulars are underwater possession-wise and have anemic game scores. Performance-wise, Andrew Mangiapane is making a case for himself for a top six job, but Austin Czarnik (sadly injured) is right there with him.
The Flames’ most common line combinations at 5v5 have been:
Gaudreau | Monahan | Lindholm |
Tkachuk | Backlund | Frolik |
Bennett | Ryan | Lucic |
Now, the defence (all situations, ordered by ice time):
Player | TOI | Goals | Points | P/60 | SH% | CF% | GF% | OZFO% | Game score |
Giordano | 339:40 | 3 | 9 | 1.59 | 9.4 | 47.2 | 50.0 | 48.8 | 0.709 |
Hamonic | 301:36 | 0 | 2 | 0.40 | 0.0 | 40.5 | 29.6 | 41.6 | 0.179 |
Hanifin | 295:25 | 2 | 2 | 0.41 | 8.3 | 48.6 | 38.1 | 50.0 | 0.379 |
Brodie | 280:18 | 0 | 6 | 1.28 | 0.0 | 49.4 | 54.2 | 48.7 | 0.439 |
Andersson | 253:18 | 1 | 2 | 0.47 | 3.8 | 56.1 | 38.9 | 62.0 | 0.354 |
Kylington | 133:33 | 0 | 0 | 0.00 | 0.0 | 51.7 | 33.3 | 62.5 | 0.090 |
Stone | 51:22 | 1 | 1 | 1.17 | 16.7 | 40.5 | 50.0 | 50.0 | 0.150 |
Everyone is a little bit worse than they were seven games ago, though Mark Giordano still carries the mail in a big way. Noah Hanifin, TJ Brodie and Rasmus Andersson have also been pretty decent. But after that it thins out a bit. The third pairing has strong possession numbers, but has also been heavily sheltered.
And finally, goalies (all situations):
Player | TOI | SV% | ldSV% | mdSV% | hdSV% | Game score |
Rittich | 650:35 | .910 | .959 | .911 | .794 | 0.723 |
Talbot | 195:00 | .908 | .953 | .913 | .778 | 0.425 |
Man, David Rittich has played a lot – the second-most in the NHL. But he’s performed well, as has Cam Talbot in extremely limited duty. Goaltending is not the reason for the Flames’ .500 record.
Breaking News
- The Flames’ best goals of 2025-26: Blake Coleman deflects it past Avalanche netminder while falling
- NHL Notebook: Sharks looking to extend Will Smith
- The Flames’ best fights of 2025-26: Ryan Lomberg fights Cole Smith in final tilt as a Flame
- A Flame from the Past: Steve Bozek
- The Flames’ best fights of 2025-26: Ryan Lomberg and Tyler Tucker land signficant blows in spirited tilt

Calgary FlamesTeam Cap Summary

Cap Summary
2026-27
2027-28
Projected Cap Hit
$89,116,666
$70,041,666
Projected Cap Space
$14,883,334
$43,458,334
Current Cap Space
$14,883,334
$43,458,334
Active Players
23/23
16/23
Draft Picks
Round
'26
'27
1
2
1
2
3
2
3
1
2