
Nation Sites
The Nation Network
FlamesNation has no direct affiliation to the Calgary Flames, Calgary Sports and Entertainment, NHL, or NHLPA
Flames in seven games: 2-4-1 in eighth segment
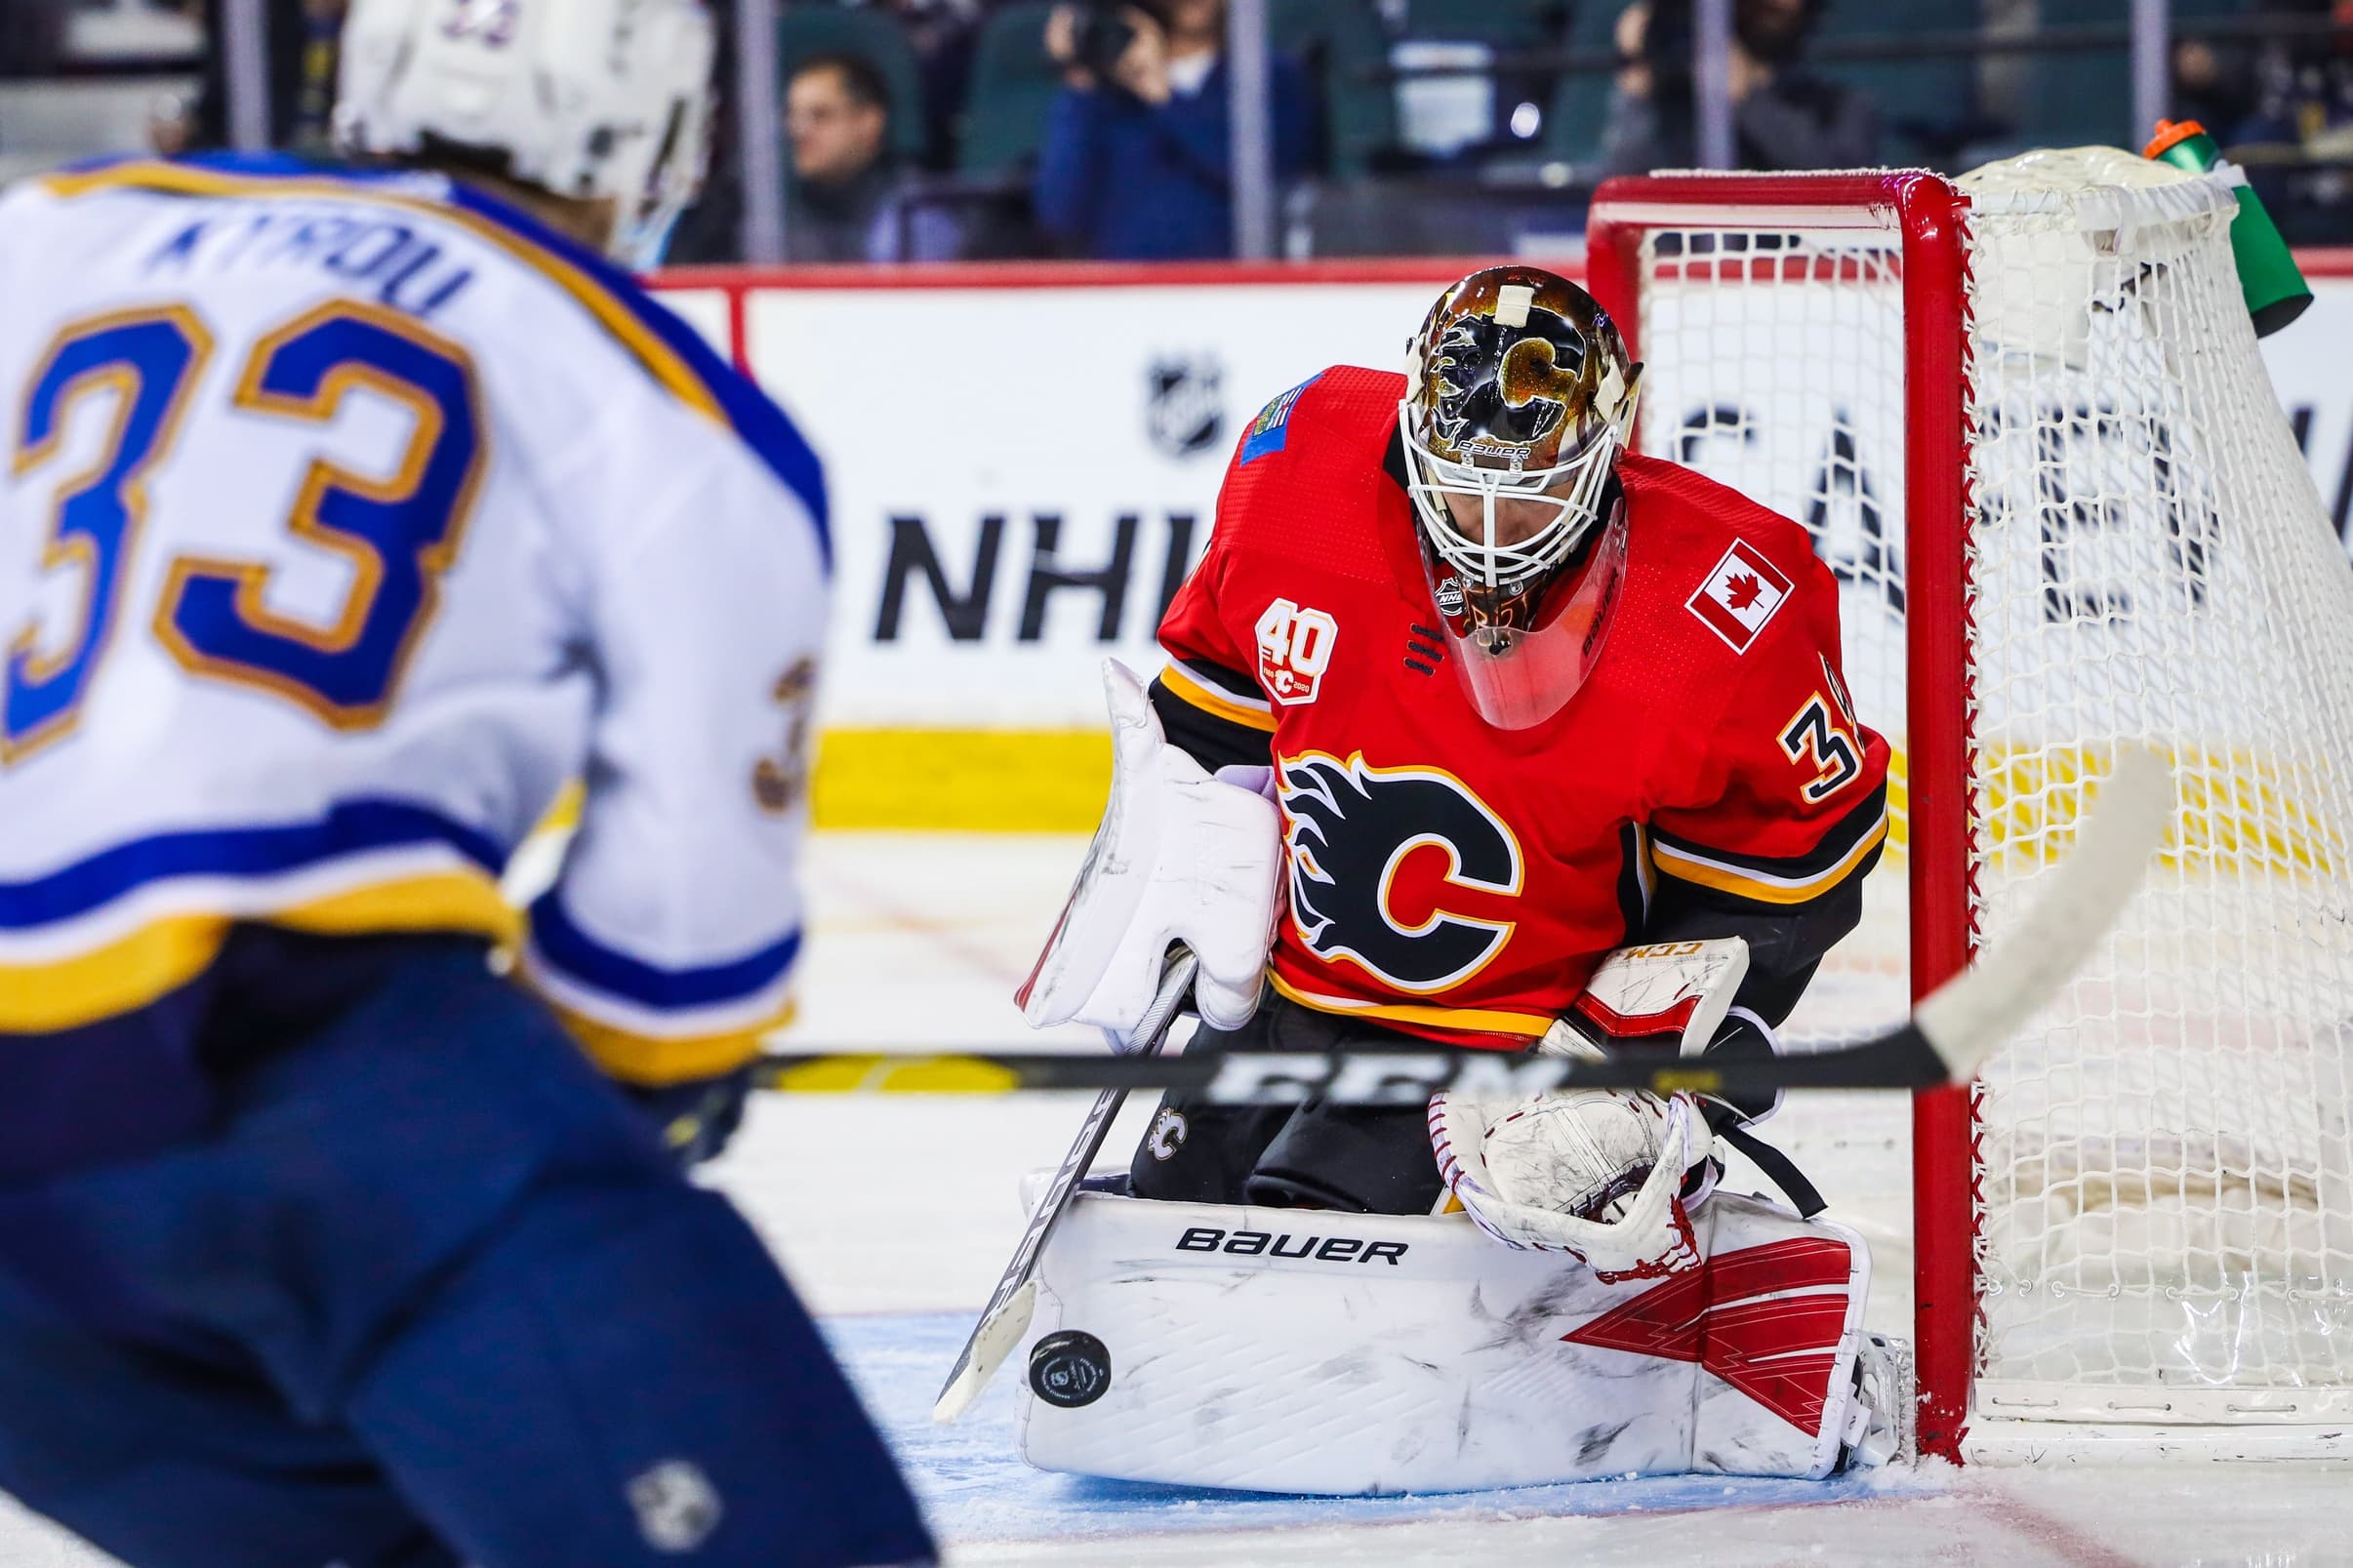
Photo credit: Sergei Belski/USA Today Sports

The Calgary Flames have completed 56 games of the 2019-20 regular season calendar. They’re 68.3% of the way through their season, and so we continue examining their performances in bite-sized seven game morsels. In the first segment of this season, they went 3-3-1. In their second segment, they went 3-3-1. In their third segment, they went 4-2-1. In their fourth segment, they went 2-4-1. In their fifth segment, they went 6-1-0. In their sixth segment, they went 2-4-1. In their seventh segment, they went 6-1-0.
In their eighth segment, they went 2-4-1.
Underlying numbers via Natural Stat Trick.
Game by game
(Percentage stats in this table are 5v5
Date | Opponent | Result | CF% | SC% | HDSC% | PP | PK |
Jan. 18 | Senators (@) | 5-2 L | 72.9 | 70.2 | 54.6 | 0-for-3 | 0-for-1 |
Jan. 28 | Blues (vs) | 5-4 SOL | 49.4 | 60.0 | 80.0 | 1-for-4 | 1-for-2 |
Jan. 29 | Oilers (@) | 4-3 SOW | 45.4 | 37.8 | 40.0 | 0-for-1 | 3-for-4 |
Feb. 1 | Oilers (vs) | 8-3 L | 41.1 | 40.0 | 33.3 | 0-for-2 | 2-for-3 |
Feb. 4 | Sharks (vs) | 3-1 L | 50.6 | 45.6 | 45.8 | 1-for-2 | 1-for-1 |
Feb. 6 | Predators (vs) | 3-2 L | 51.7 | 50.0 | 58.8 | 0-for-2 | 0-for-1 |
Feb. 8 | Canucks (@) | 6-2 W | 47.9 | 53.5 | 66.7 | 1-for-1 | 3-for-3 |
The Flames played four games at home (0-3-1) and three on the road (2-1-0). For those who like to keep track, the Flames had one win and four losses in regulation, and went to overtime twice (winning once and losing once in shootouts). Considering the first tie-breaker is regulation wins, they need to get more done in the first 60 minutes.
The Flames out-chanced their opponents three times and generated more high danger chances four times. They scored three power play goals and allowed five.
With 62 points thus far, the Flames are performing at slightly below a playoff pace; four wins per segment translates to precisely 64 points over 56 games (and to 94 points over a full season). They’ve slid from firmly in the race – and potentially in division contention – to hanging in there. Thankfully, the Pacific is awful so they’re not that far back from the top spot in the division.
Team stats
The Flames have a 28-22-6 record through their first 56 games. They remain a very inconsistent hockey club.
- Their goals for per game is 2.66, up from 2.61. They’re 25th overall in the NHL and 11th in the Western Conference.
- Their goals against per game is 3.04, up from 2.90. They’re 16th in the NHL, and 7th in the Western Conference.
- Their goal differential is -16, down from -9. They’re 24rd in the NHL, and 12th in the Western Conference.
- Their power play is at 20.3%, up from 18.9%. They’re 12th in the NHL, and 6th in the Western Conference.
- Their penalty kill is at 81.5%, down from 83.0%. They’re 12th in the NHL and 6th in the Western Conference.
- They’ve taken 9.4 minutes of penalties per game, up from 8.5. That’s 7th-most in the NHL, and 3rd-most in the Western Conference.
- Their 5v5 CF/60 is 58.36, down from 58.41. It’s the 9th highest in the NHL, and 5th highest among Western Conference teams.
- Their 5v5 CA/60 is 57.50, down from 57.95. It’s the 23rd lowest in the NHL, and 11th lowest among Western Conference teams.
- Their 5v5 CF is 50.4%, up from 50.2%. It’s the 13th highest in the NHL, and 5th among Western Conference teams.
- Their 5v5 shooting percentage is 6.86%, up from 6.67%. It’s 29th in the NHL.
- Their 5v5 save percentage is 92.06%, down from 92.49%. It’s 13th in the NHL.
- Their PDO is 0.989, down from 0.992. It’s 26th in the NHL.
The Flames continue to be a weird, frustrating hockey team. Their strengths include their special teams (top half of NHL), shot attempt generation (top 10) and goaltending (top half). But their defensive play isn’t too hot, nor is their shooting. We’ve been writing this same combination of stuff all season, because the story has remained very consistent in that respect.
Player stats
First, the forwards (all situations, ordered by ice time).
Game scores: 0.950 and above is considered great; 0.450-0.950 good; 0.150-0.450 fine; -0.150-0.150 bad; under -0.150 awful.
Player | TOI | Goals | Points | P/60 | SH% | CF% | GF% | OZFO% | Game score |
Lindholm | 1102:34 | 22 | 42 | 2.29 | 16.5 | 51.7 | 46.8 | 52.0 | 0.715 |
Gaudreau | 1051:49 | 14 | 44 | 2.51 | 9.0 | 56.6 | 53.6 | 67.8 | 0.755 |
Monahan | 1013:28 | 17 | 39 | 2.31 | 12.7 | 55.6 | 51.7 | 67.5 | 0.636 |
Tkachuk | 1001:31 | 18 | 44 | 2.64 | 11.9 | 58.4 | 55.6 | 60.3 | 0.861 |
Backlund | 1000:04 | 6 | 26 | 1.56 | 5.4 | 50.0 | 48.9 | 50.9 | 0.421 |
Ryan | 834:30 | 10 | 27 | 1.94 | 11.2 | 47.3 | 54.7 | 43.0 | 0.466 |
Lucic | 717:37 | 5 | 13 | 1.09 | 8.1 | 55.0 | 55.9 | 52.3 | 0.265 |
Mangiapane | 701:01 | 10 | 18 | 1.54 | 12.8 | 53.0 | 48.3 | 45.2 | 0.454 |
Bennett | 511:21 | 5 | 9 | 1.06 | 7.7 | 53.7 | 51.7 | 51.9 | 0.289 |
Rieder | 480:12 | 3 | 8 | 1.00 | 5.1 | 44.7 | 25.7 | 43.0 | 0.241 |
Jankowski | 468:18 | 1 | 3 | 0.38 | 7.7 | 43.4 | 20.0 | 29.9 | 0.092 |
Frolik | 453:16 | 5 | 10 | 1.32 | 11.4 | 48.3 | 31.4 | 46.8 | 0.247 |
Dube | 386:13 | 4 | 10 | 2.02 | 12.5 | 46.6 | 62.1 | 47.3 | 0.369 |
Rinaldo | 112:46 | 2 | 3 | 1.68 | 18.2 | 41.0 | 42.9 | 44.2 | 0.065 |
Quine | 88:15 | 1 | 1 | 0.68 | 8.3 | 51.6 | 33.3 | 49.1 | 0.179 |
Czarnik | 81:30 | 2 | 3 | 2.21 | 22.2 | 54.6 | 75.0 | 58.9 | 0.394 |
Robinson | 61:10 | 1 | 1 | 0.98 | 16.7 | 47.2 | 50.0 | 46.2 | 0.250 |
Still no real big usage changes under Geoff Ward as compared to Bill Peters’ deployments.
Who’s doing well? Matthew Tkachuk, followed by Johnny Gaudeau, Elias Lindholm and Sean Monahan, followed further back by Derek Ryan, Andrew Mangiapane and Mikael Backlund. The chatter about these guys struggling is more that they’re struggling compared to last season – allowing more goals and chances and producing less of them themselves.
Gaudreau, Backlund, Milan Lucic and Sam Bennett are all shooting single digits despite having career shooting percentages generally much higher than that. Eventually, they should bounce back. Probably.
The Flames’ most common line combinations at 5v5 are:
Gaudreau | Monahan | Lindholm |
Mangiapane | Lindholm | Tkachuk |
Lucic | Ryan | Dube |
Now, the defence (all situations, ordered by ice time):
Player | TOI | Goals | Points | P/60 | SH% | CF% | GF% | OZFO% | Game score |
Giordano | 1293:10 | 5 | 27 | 1.25 | 3.5 | 51.3 | 51.8 | 49.4 | 0.718 |
Hanifin | 1200:18 | 5 | 15 | 0.75 | 4.6 | 49.6 | 43.6 | 46.7 | 0.361 |
Andersson | 1079:07 | 4 | 15 | 0.83 | 3.9 | 53.8 | 43.0 | 61.4 | 0.380 |
Hamonic | 1058:40 | 3 | 12 | 0.68 | 3.6 | 43.4 | 39.3 | 34.2 | 0.348 |
Brodie | 1005:25 | 1 | 14 | 0.84 | 2.0 | 50.3 | 47.8 | 44.7 | 0.375 |
Kylington | 558:31 | 1 | 4 | 0.43 | 3.2 | 48.5 | 38.9 | 61.7 | 0.096 |
Stone | 387:12 | 2 | 4 | 0.62 | 4.8 | 40.4 | 40.7 | 44.4 | 0.104 |
Davidson | 51:19 | 0 | 0 | 0.00 | 0.0 | 54.7 | 20.0 | 58.3 | 0.356 |
The bad news is the team’s runaway best defender is hurt.
That puts a lot of pressure on their quartet of “completely fine” defenders. None of them are moving the needle amazingly this season, but they’re also not getting clobbered. It’ll be curious how Rasmus Andersson does (a) away from Oliver Kylington or Mark Giordano and (b) with much less offensive zone sheltering than he’s had all season.
Michael Stone is a perfectly adequate seventh defender, but how will he fare when pressed higher into the rotation?
And finally, goalies (all situations):
Player | TOI | SV% | ldSV% | mdSV% | hdSV% | Game score |
Rittich | 2352:24 | .909 | .960 | .880 | .848 | 0.704 |
Talbot | 1017:28 | .915 | .969 | .904 | .802 | 0.918 |
This is very much the same breakdown we’ve seen all season, albeit with Rittich’s game score dragged down by the Edmonton 8-3 loss. Talbot’s better at medium and low danger shots, while Rittich has a clear high danger edge.
Both goalies have had to hold the Flames in a lot of games this season.
Breaking News
- Olympic Men’s Hockey Quarterfinal Recap: Canada survives nail-biter as three of four games go to overtime
- Flames roster news: Matvei Gridin recalled from AHL’s Wranglers
- FN’s mid-season Flames prospect updates: Andrew Basha
- Flames prospect Ethan Wyttenbach is a unicorn
- 5 Flames Takes: Do the Flames already have their top scorers of the future?