Advanced Stats Crash Course: Possession (Part 2)

By Kent Wilson
10 years ago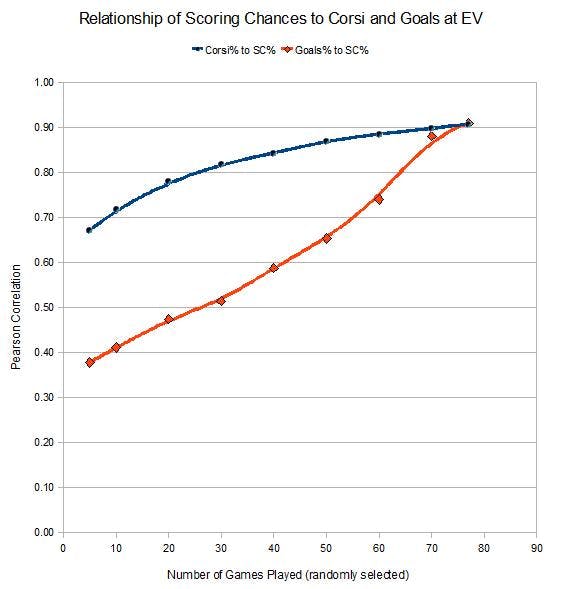
In part one of the this series, we took a look at the basics of corsi: what it is, where it came from and why it’s useful. In this segment, we’ll go a little deeper into possession metrics by looking at some of the key moderating variables. We’ll also look at what constitutes absolute and relative values of "good corsi" as well as cover the caveats and limitations of possession measures.
Corsi in Context
Like all performance measures, possession rates have to be couched in the context of a player’s circumstances and environment in order to yield truly worthwhile anlyses. Aside from pure talent level (and other idiosyncratic elements you might want to include here such as "tenacity", "will", etc.), external forces also act to determine a player’s output, including ice time, quality of line mates and difficulty of minutes.
Following is a list of the primary contextual elements that must be taken into account when considering a player’s possession rate:
Quality of Team (General)
High tide raises all ships. Although this isn’t always necessarily true for every player on every club, usually playing on a great (or terrible) team will act to drag a guys possession ratio up (or down). Sometimes this has to do with simply getting to play with other good/bad players, but other global effects like coaching and systems play are a factor as well.
Quality of Teammates (specific)
Of course, there are tiers of talent inside each NHL team and who a guy tends to skate with at even strength can have a significant influence on his corsi rate. If you’re stuck for 10 minutes a night with your club’s designated enforcer, you’re more or less skating with a man down. On the other hand, playing with Sidney Crosby or Pavel Datsyuk would almost like being on a perpetual powerplay.
Quality of Opposition
Who on the other team a player frequently faces is also an issue, though it’s probably not as important as was initially theorized. While most top-9 type forwards likely face roughly equivalent levels of other top-9 forwards over time, there are likely a few outliers for whom quality of competition is a real factor (such as top-pairing, shut-down defenders who consistently see the big guns and replacement level 4th liners who only ever see other 4th liners).
Difficulty of Starting Position
NHL coaches often widely vary how frequently they start certain players in the defensive or offensive zones. This year, for example, Mike Ribeiro has an offensive zone to defensive zone ratio (or zone start) of 71.3%, the highest in the NHL. In contrast, Brandon Bollig has a zone start of just 18%. With each additional offensive zone or defensive zone faceoff worth about +/- 0.35 corsi on average, an extreme zone start differential can skew a player’s possession one way or the other.
Playing to Score Effect
One of the most interesting findings to emerge from the work on possession over the last few years is the playing-to-score effect – the persistent tendency for teams who are leading to sit back (ie; yield more shots on net) while trailing teams to press forward (ie; generate more shots on net). Because leading or trailing can often skew shot results due to this effect, it is sometimes advisable to look at possession rates when the score is tied or at least +/- a goal.
Judging Possession Rates
This is probably there area where new stats tend to lose people. While most hockey fans have at least an approximate idea of the range and value of most conventional stats, a lack of familiarity with corsi and the like makes it harder to attach the numbers to any sort of meaning.
For instance, most folks know that a 20-goal scorer is good/rare or that a 50-goal scorer is probably elite. There are similar rules of thumb for possession metrics.
50% or 0.00 is the baseline
Corsi can be expressed in two different ways: a ratio/percentage (all shots for / all shots against) or a rate differential (all shots for – all shots per 60 minutes of ice time). All things being equal, the minimum standard most coaches and players typically strive for is a corsi of about 50%, which can also be expressed at as a differential of 0.00/60. Either way, it means a team is getting as many shot attempts for and against while a player is on the ice.
To determine the range of possession stats in the NHL (ie; elite to lousy), refer back to the infographic in part 1: elite teams are the 55%+ club while the basement dwellers are 45% and below. That range is the general guidepost to use when looking at corsi ratios: anyone at about 55% is spending a lot of time in the offensive zone. Conversely, anyone at 45% or below is seeing a lot of rubber flying at his own net. In terms of differentials, you are usually in rarefied territory when hitting double digits either way. So a +10/60 corsi or higher is generally excellent while a -10/60 corsi or worse is generally terrible.
The impossible ideal, of course, is to have a corsi ratio of 100% because this would mean a team owning 100% of the shot attempts in the game: all shots for, no shots against.
Absolute vs Relative Corsi
Of course, all things are rarely equal. While a corsi ratio of 55% tells us a player is spending a lot of time in the offensive zone, it doesn’t necessarily mean he is driving those results. To determine the degree to which a corsi number is actually representative of a player’s ability (and not merely his circumstances), all the factors listed above must be considered: quality of team, quality of linemates, quality of competition, zone starts and playing-to-score.
There are established and emerging math-y ways to adjust corsi to correct for these various factors, but we’ll leave most of those aside for the moment. It’s possible to get a feel for the influence of these factors without having to break out tables and regression equations all the time.
Let’s take a look Mikael Backlund and Sean Monahan from the Calgary Flames as test cases. All numbers and such sourced from Extra Skater.
Backlund Test Case
Backlund’s corsi ratio is 47.3%. Monahan’s at 41.3%. In absolute terms, those numbers are below average and terrible, respectively. However, Extra Skater allows us to look up contextual factors which we can apply to the analysis.
The Flames as a whole have a corsi ratio of just 44.3% so far this season (yup, they’ll be picking in the top-5 come the draft). That puts Backlund’s rate in different light: he’s more than 3% above the club as a whole. We can actually look up Backlund’s relative corsi rate using Extra Skater – that is, the player’s possession ratio relative to his club’s possession rate in the games he has played (wit the difference being shot rates while he is on and off the ice).
Backlund’s relative corsi percentage so far this season is actually +5.0%, the second highest on the Flames so far behind Michael Cammalleri. If we check Behind the Net, we can put those rates into slightly more intuitive numbers: Backlund’s relative corsi/60 is +12.6/60 minutes of ice time this year. That means, the Flames are currently +12.6 per hour of evne strength ice time corsi better when Backlund is on the ice versus when he is on the bench, which is a huge swing.
Of course, we also have to consider Backlund’s zone start ratio – his relatively strong possession numbers won’t be that impressive if he’s starting more often than the rest of his club in the offensive zone.
The truth is, in fact, the opposite. Backlund’s zone start is just 43% this year (ozone faceoffs/dzone faceoffs), the 4th lowest amongst regular forwards on the team. Backlund is also in the top-6 in terms of quality of competition (and would be higher had Bob Hartley not demoted him to the 4th line for a brief spell).
The Flames don’t have any real difference makers in terms of possession forwards, so we probably don’t have to worry too much that Backlund’s line mates are driving the results. However, if this was a concern we could conduct a WOWY (with or with out you) analysis which would tell us how each of Backlund’s frequent linemates did with and without him from a possession perspective.
Summary: Backlund has a tough starting position, plays against top-6 competition and the Flames have a much better corsi ratio when he’s on the ice versus when he’s on the bench. As such, his nominally unimpressive 47.3% raw corsi percentage is actually quite good given his circumstances.
Monahan Test Case
Sean Monahan had a strong start to the year in terms of offensive output, but the possession stats are nowhere near as complimentary. The youngster’s raw 41.3% corsi number is sub-replacement level (ie; you could call up a standard AHL guy and get a performance at least as good, if not better).
The news gets worse from there: Monahan’s relative corsi is -4.9%. In terms of shot attempts per 60 minutes of ice, that comes out to -9.8/60. Again, that means the Flames possession differential is -9.6 per 60 minutes with Monahan on the ice versus when he’s on the bench. The only two regular forwards who are worse than that so far are 4th liners Lance Bouma (-12.8/60) and Brian McGrattan (-18.6/60).
Furthermore, Monahan’s possession results are not due to tough sledding. In fact, he’s seen some of the easiest ice time on the team. His zone start ratio is 60.8% (!), the highest of any regular forward on the club so far. To put that number in further context, only 41 regular NHL players have a ZS above 60% this season, with 32 of them being forwards which results in Monahan having the 27th easiest ZS amongst forwards in the league. According to behindthenet, the only forward who has seen easier competition this year is McGrattan.
Sean’s most frequent linemates this year have included Jiri Hudler, Sven Baertschi, Lee Stempniak, Dennis Wideman and Kris Russell. It would be worth investigating Sean’s results further given how poor they are, but it doesn’t seem like he’s being pulled down by any particular player.
Summary: Monahan is spending a lot of time in the defensive zone despite favorable circumstances, such as an unusually high zone start ratio and decent line mates. It’s possible he came back too early from a foot injury and that may be a cause of his possession struggles, but on the surface these numbers suggest he shouldn’t be playing in the NHL.
Test Case Conclusion
That all seems like a lot of work, but with increasing familiarity and practice, it becomes a matter of a few clicks and a minute or two to research a particular player’s corsi and circumstances.The above exercises also stress how important it is to evaluate a player’s result relative to the rest of his team, which is why a quick ordered ranking of possession and related metrics is a key to understanding the numbers. Always make sure to take note of things like sample size of games and minutes played as well.
Caveats and Limitations
Obviously possession measures (and associated metrics) don’t completely determine a player’s skill level or worth. There is no one number that does this. Perfect prediction is obviously impossible, so the goal isn’t to be omniscent, it’s to improve our understanding of the game in small increments – be less and less wrong; less prone to the big errors.
Still, corsi is not a holistic measure. It excludes special teams play and doesn’t in any way measure goaltending performance. Both can go a long way to determining success rates, particularly elite puck stopping. Also, corsi theory is very young (less than 7 years old), so we are only scratching the surface of our understanding of how possession is moderated and relates to outcomes like offense, defense and winning.
We also aren’t completely sure what coaching or player qualities drive possession. We can infer based on which players and teams are consistently above board possession-wise, but there has been no long-term, controlled observational studies that definitely prove how or why certain guys are good at driving the play north (and other guys aren’t). There have been some steps in this direction with the zone entry project suggesting play in the neutral zone (ie; crossing the blueline with possession) has a strong influence on corsi, but more study is needed to prove it one way or the other.
Corsi measures are also rather broad brush – if you’re looking for something that can predict who is going to win the next game between team X and team Y, you’ll need to search elsewhere.
Finally, corsi doesn’t address shot quality, which is often the big knock from those who oppose the measure. While we will get into this issue in greater detail in the next article, studies of the modern NHL have shown that shot quality at a team level is something that doesn’t persist – meaning differences in terms of SH% and SV% is almost entirely due to randomness and goaltending ability.
Which isn’t to say there aren’t shots of differing quality (there obviously are), only that, at the team level, no one in the NHL can reliably and consistently suppress or generate quality shots for or against long-term. This likely wasn’t true of the classic dynasty type clubs but aggressive expansion and the salary cap have made it very difficult to assemble a team that can control the percentages over the long term. In short, parity is why percentages are mostly the province of lady luck.
That said, there is some suggestion a few highly skilled forwards can drive SH% to some degree (and a few lowly skilled forwards can’t even manage average rates). We will deal with them and how shot volume and goal frequency interact in the next post.
Recent articles from Kent Wilson