Black Box: Week 9

12 years ago
Three very strong games got the Calgary Flames five points, boosting them to exactly where they were last year at this point. Weekly followers of the Black Box know that their goaltending and even-strength play has been reasonable, but they’ll need much-improved special teams play and more even-strength offense to get the 73 points in the 57 remaining games (.640, like Chicago and 6 other current teams) to clinch their first play-off berth since Mike Keenan was behind the bench and Mike Cammalleri was their leading goal-scorer.
OZQoC Charts (explanation)
The Calgary Flames have been a four-defenseman team all season, reminiscent of the 1986-era Philadelphia Flyers that just played Mark Howe, Brad McCrimmon, Doug Crossman and Brad Marsh to death. While the other Flames defensemen do get some ice-time, there’s no way you’ll see anyone other than Jay Bouwmeester, Chris Butler, Scott Hannan or Mark Giordano on the ice when they’re down a man, in the final few minutes, or up against a top-six line.
The injury to Mark Giordano forces them to play at least one of T.J. Brodie, Derek Smith, Anton Babchuk or Cory Sarich in the defensive zone once in a while, and against opponents better than anyone the Flames have ever received from Toronto in exchange for a franchise player.
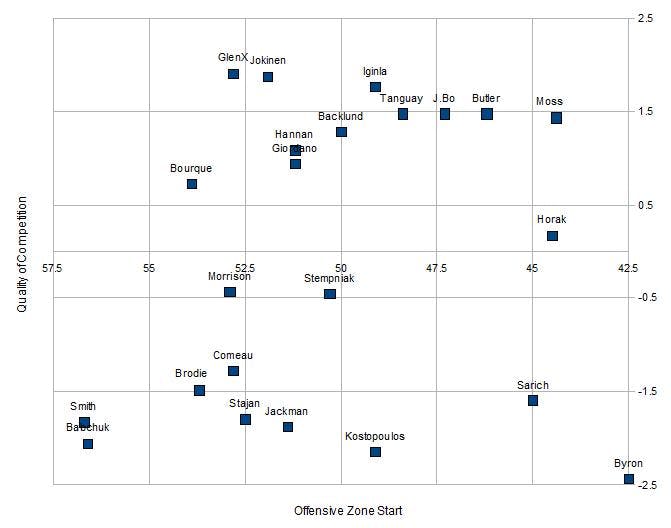
Up front Mikael Backlund’s ice-time has settled into a more balanced role, but it looks like Coach Brent Sutter is starting Blake Comeau off in more of an easy depth-type position so don’t be overly stunned by his strong start. Paul Byron actually gets worse ice-time than shown, we just wanted to squeeze him onto the chart.
Even-Strength Scoring (explanation)
Mikael Backlund continues to go strong in terms of possession and scoring chances, which will eventually translate into goals. There was also a big jump for Blake Comeau – 2.4% in Corsi events and a 60% increase in offensive scoring chance rate, leading to a tripling of goal percentage. While it’s true this is due to enjoying some easy ice-time, at least those terrible numbers on the Island are starting to get diluted.
Forward        ESP/60 CEF CEA  CE% SCF SCA SC%   GF   GA    G%
Mikael Backlund  0.4   58  47 55.4% 20 15 57.8% 1.68 3.35  33.4%
Matt Stajan      1.3   56  49 53.4% 13 13 50.0% 1.88 3.13  37.5%
Tim Jackman      1.2   49  43 53.3% 11 11 49.3% 1.44 2.89  33.3%
David Moss       1.9   55  49 53.0% 11 14 43.3% 1.85 1.48  55.6%
Lee Stempniak    2.0   55  49 52.6% 16 14 53.2% 2.93 2.73  51.8%
Blake Comeau     0.7   53  51 50.3% 16 11 59.3% 0.94 3.05  23.6%
Tom Kostopoulos  1.3   47  48 49.5% 12 10 54.1% 2.68 2.41  52.7%
Brendan Morrison 0.5   50  52 49.4% 15 15 50.0% 1.49 0.50  74.9%
Alex Tanguay     2.1   53  57 48.3% 20 15 57.3% 2.32 2.68  46.4%
Jarome Iginla    1.2   52  57 47.8% 17 16 51.7% 1.99 2.60  43.4%
Olli Jokinen     1.9   51  57 46.8% 14 16 47.4% 2.94 2.76  51.6%
Curtis Glencross 2.1   51  57 46.8% 14 15 49.7% 2.68 3.06  46.7%
Rene Bourque     1.1   46  54 45.7% 11 17 40.1% 2.27 2.27  50.0%
P-L. Leblond     0.0   46  58 43.9%  8 12 40.0% 4.16 0.00 100.0%
Roman Horak      1.8   40  56 41.9% 14 13 51.7% 2.52 1.38  64.6%
Paul Byron       2.0   30  57 34.8% 13 14 48.1% 3.92 0.00 100.0%
Having dominated the opposition all week, the scoring chance rate jumped for almost everyone. Flames Forwards went from only five players enjoying scoring chance supremacy to nine with huge jumps by Bourque (5.1%), Horak (3.8%), Tanguay (3.5%), Kostopoulos (3.4%), Jackman (2.9%), Iginla (2.5%), and Jokinen (2.5%).
Notice that there was no similar jump in possession numbers, because a lot of this was simply their scoring chance data starting to more accurately reflect possession. Hopefully the next correction is on the scoreboard, because players like Backlund, Stajan, Jackman, Tanguay and Iginla have had goal percentages far out of whack with either their possession or scoring chance totals.
On defense it was yet another tough week for Bouwmeester, his possession numbers now dropping below the water line, dropping 1.4% on the week, but fortunately everyone else seems to be headed the right direction.
Defense        ESP/60 CEF CEA  CE% SCF SCA SC%   GF   GA    G%
Derek Smith      0.7   52  46 53.0% 14 11 57.0% 2.60 1.65  61.2%
T.J. Brodie      1.2   50  46 52.4% 16 11 59.4% 2.72 1.56  63.6%
Chris Butler     0.7   53  51 50.9% 16 15 50.7% 2.41 2.55  48.6%
Joe Piskula      0.0   39  39 50.0%  6 13 33.3% 0.00 12.93  0.0%
Jay Bouwmeester  0.7   51  52 49.4% 15 16 48.3% 2.47 2.34  51.4%
Cory Sarich      0.3   49  50 49.7% 12 10 55.1% 1.89 2.20  46.2%
Mark Giordano    0.7   48  58 45.7% 14 15 48.3% 2.29 2.29  50.0%
Scott Hannan     0.7   47  57 45.1% 15 15 50.0% 2.41 2.12  53.2%
Anton Babchuk    1.4   46  64 41.8% 10 17 36.8% 2.07 2.07  50.0%
A strong week by T.J. Brodie but be warned that his impressive scoring chance and goal percentages make him look a lot better than he actually is, not to mention his incredibly sheltered ice-time.
Special teams (explanation)
The Flames were lucky this week, not good. Under the hood it was another bad week for the Flames power play, whose already terrible attempted shot totals continue to drop. It’s hard to understand how they expect to score goals when they barely attempt two shots per power play, on average. You need at least four, or like King Kong Bundy used to scream, FIVE!
Player              TOI/GP PTS/60 CE/60
Anton Babchuk        2.2     3.4   94.7
Roman Horak          0.8     0.0   90.7
Chris Butler         0.4     5.6   89.3
David Moss           1.3     0.0   88.7
Jay Bouwmeester      2.1     3.4   81.5
Lee Stempniak        1.8     0.0   76.1
Jarome Iginla        3.3     5.1   75.6
Brendan Morrison     1.0     0.0   75.4
Olli Jokinen         3.0     4.0   74.9
Blake Comeau         0.6     0.0   73.5
Mikael Backlund      1.5     3.6   71.4
Tim Jackman          0.7     0.0   71.4
Rene Bourque         2.9     3.3   70.9
Mark Giordano        3.5     3.0   70.0
Derek Smith          0.9     3.6   68.7
T.J. Brodie          1.3     4.3   68.2
Curtis Glencross     1.9     2.6   65.7
Alex Tanguay         3.4     3.6   64.3
Fortunately they had another great week killing penalties, slowly putting some distance between them and the league’s worst penalty killers. Still you’ll notice that their opponents have a lot more success controlling the play and attempting shots with the man advantage than the Flames do.
Player           TOI/GP CE/60
Jay Bouwmeester   3.5    96.1
Scott Hannan      2.7    86.4
Chris Butler      2.5    93.3
Curtis Glencross  2.3    93.5
Mark Giordano     2.2    92.6
Lee Stempniak     1.8    84.0
Rene Bourque      1.7    84.7
David Moss        1.5   143.1
Tom Kostopoulos   1.5    92.5
Mikael Backlund   0.9    87.5
Alex Tanguay      0.8    67.2
Matt Stajan       0.7   138.5
Blake Comeau      0.7    84.0
Brendan Morrison  0.6    84.6
Cory Sarich       0.6   166.6
Olli Jokinen      0.5    81.0
Roman Horak       0.4   111.9
A strong week by their remaining three penalty-killing defensemen, who are now getting ice time that’s making even Mark Howe shake his head, and by Rene Bourque and Tom Kostopoulos up front. The addition of Alex Tanguay and newcomer Blake Comeau to the secondary penalty killing units is also to credit for their over-all improvement.
Goaltending (explanation)
Kipper picked up a shut-out against Nashville, could have played better against both Columbus and Edmonton, but still has his highest even-strength save percentage since 2006-07, and about the same Quality Start percentage as last year, a level sufficient for an average team to make the play-offs.
Goalie           GS QS  QS%  ESSV%
Miikka Kiprusoff 21 12 57.1%  .929
Henrik Karlsson   4  1 25.0%  .910
Unfortunately the Flames are on course for another 10th place finish, but every year there’s at least one team that starts below .500 but plays well, gets the bounces, and surprises the league with a post-season appearance, and Calgary is positioned no worse than Colorado, Tampa Bay or the Islanders to be that team this year.
Recent articles from Robert Vollman