Calgary’s Role Changes

12 years ago

Whose role changed the most from 2010-11 to 2011-12? You’d probably say Chris Butler, who went from Buffalo’s depth blue line to Calgary’s top pairing, or perhaps Cory Sarich and Matt Stajan, who went from useful secondary players to the depth lines.
Fortunately, there’s a way to objectively measure player’s role changes from season to season using the same OZQoC charts we’ve reviewed every week this season (here’s last year’s, and this year’s final result). By looking at how the percentage of a player’s offensive zone starts has increased or decreased, along with the average level of their competition, we get the insight we need to put both our subjective opinions of their play and their objective statistical results into perspective.
While it’s not completely appropriate to compare Quality of Competition from one year to the next like this, especially for those who played on different teams, the chart below can show you how player’s assignments changed this year. Players who saw tougher competition are at the top, and players who saw fewer offensive zone starts are on the right, meaning that players to the top-right had tougher assignments this year, and those on the bottom left were easier.
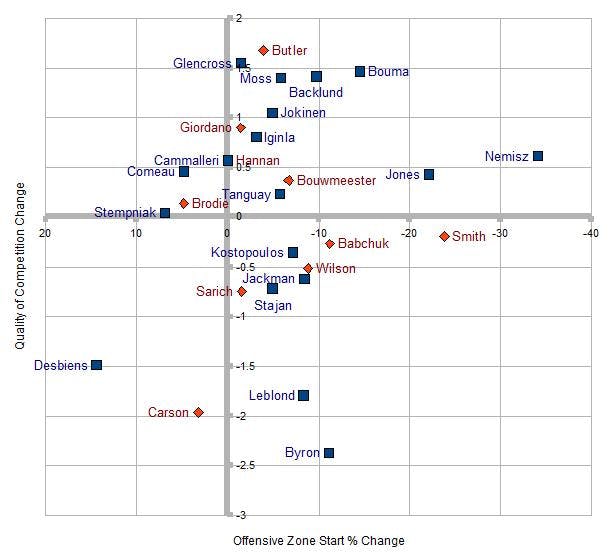
The bottom left hand quadrant includes players that enjoyed much easier assignments this year, facing both easier competition and starting in the offensive zone more often. Since only two players qualified, and in very limited action (Guillaume Desbiens and Brett Carson), you can conclude that nobody really enjoyed the conditions for a breakout season.
The top left hand quadrant is almost as unpopulated, as it includes players that faced tougher competition, but got to enjoy more starts in the offensive zone. It includes young T.J. Brodie and new arrivals Blake Comeau and Lee Stempniak – who were used in much more defensive-minded roles in Long Island and Phoenix respectively.
The bottom right hand quadrant is for players who started in their own zone more often – which was the case in 22 of 27 cases, but against weaker competition. Essentially these players were demoted from higher positions on the depth chart, but were still largely used in same way.
On defense demotions included Anton Babchuk, Derek Smith, Clay Wilson and especially Cory Sarich. These aren’t necessarily easier assignments, especially for Babchuk and Smith who previously got to play almost exclusively in the offensive zone, but had to play in more balanced situations this season.
Up front Pierre-Luc Leblond and Paul Byron were protected against all but the very lightest of competition, while the fourth line of Tom Kostopoulos, Tim Jackman and Matt Stajan were no longer regularly used against the middle lines – which makes it all the more puzzling why they all had terrible seasons.
The most interesting quadrant is the top-right, which includes players that had to start in the defensive zone more often, and also against tougher competition.
On the blue line we were correct to assume that Chris Butler had the biggest role change, but Mark Giordano also saw tougher competition, which was expected in Robyn Regehr’s absence. Scott Hannan and Jay Bouwmeester were used in fairly comparable fashion as last year, with Bouwmeester having to start in his own zone more often than the year before (although that doesn’t entirely excuse his terrible -21 plus/minus).
Up front the OMG line of Olli Jokinen, David Moss and Curtis Glencross, who were historically used against 2nd or 3rd lines, became Sutter’s preferred choice against opposing top lines, a move that may not have taken a bite out of their scoring, but left them with big drops in plus/minus. Meanwhile the top tier players Jarome Iginla, Mike Cammalleri and Alex Tanguay saw only slight increases in the difficulty of their assignments, so their poor seasons are more likely a consequence of age and injury.
Blair Jones and Greg Nemisz both saw the biggest decreases in the percentage of shifts they started in the offensive zone, which fortunately didn’t seem to have much of an impact on their results. More interesting are the cases of Mikael Backlund and Lance Bouma. Backlund went from carefully sheltered minutes in the offensive zone to top-six minutes, and subsequently went from 25 points in 73 games and +4 to 11 points in 41 games and -13. Bouma went from 16 games of under 6 minutes of the most sheltered time possible to almost a regular shift, and scored just 3 points in 27 games with a -5.
Final Word
My personal favourite part of the weekly Black Box was the OZQoC chart because it showed at a glance how each of the players were being used. The weekly OZQoC charts were a fantastic way to know what to expect from each player, and to help explain otherwise curious changes in any of their numbers.
Looking at 2011-12’s numbers in this way one final time helps put each player’s individual performances into context. As we go through the rest of the year’s-end black box statistical summaries in the weeks to come, this chart should help set the right context for interpreting the results. For instance, we’ll go easier on player’s like Chris Butler, Mikael Backlund, Lance Bouma and the OMG line, while remaining relatively skeptical of any improvements we may accidentally discover in the play of Cory Sarich and the veteran fourth line of Tom Kostopoulos, Tim Jackman and Matt Stajan.
Next week: A look a the even-strength possession numbers. Who helped drive the play in Calgary’s favour, and who helped convert shots to chances, and chances to goals?
Recent articles from Robert Vollman