Flames 2010-2011 Scoring Chance Results

By Kent Wilson
12 years ago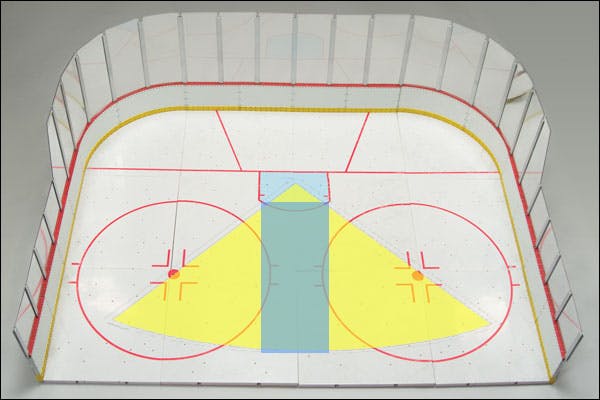
As most are no doubt aware, I spent the season assiduously counting scoring chances for the each and every Flames game. I popped up on the FAN960 to discuss individual results now and then, but the real interest in the scoring chance project comes in the off-season when we can collate all the information and really get a feel for who did what.
I have defined scoring chances a number of times in this space and elsewhere, but for the sake of this post, here’s what I considered a "scoring chance" during the season: a shot at the net from the prime scoring zone on the ice, designated as a roughly the pie-shaped area extending from the crease through the face-off dots to the top of of the circles, give or take a stride or two. Some exceptions apply (shots slightly outside the area when the goalie is well out of position, or very well screened point shots), but that was it primarily.
I excluded shots that were blocked close to the source, meaning if a player managed to get the puck a shoot from the scoring area, but was firing into the shins of a defender in front of him, the shot would not be counted as a chance. Missed shots/posts were mostly included (as long as the miss was reasonably close to the net). "Chances at chances" were also exlcuded, meaning if a player had a break-away but tripped at the blueline, nothing was tallied. Ditto for a two-on-one that didn’t result on a shot at the net.
Anyways, without further ado, here’s the individual results, ranked by scoring chance ratio:
| FORWARDS | SC% | Fenwick % |
|---|---|---|
| C. CONROY | 0.577 | 0.550 |
| D. MOSS | 0.564 | 0.562 |
| M. BACKLUND | 0.554 | 0.574 |
| A. KOTALIK | 0.550 | 0.536 |
| T. JACKMAN | 0.543 | 0.593 |
| A. TANGUAY | 0.540 | 0.509 |
| J. IGINLA | 0.537 | 0.517 |
| C. GLENCROSS | 0.532 | 0.542 |
| M. STAJAN | 0.528 | 0.530 |
| N. HAGMAN | 0.513 | 0.516 |
| O. JOKINEN | 0.512 | 0.502 |
| B. MORRISON | 0.508 | 0.500 |
| T. KOSTOPOULOS | 0.502 | 0.546 |
| R. BOURQUE | 0.466 | 0.479 |
| Defense | SC% | Fenwick % |
|---|---|---|
| M. GIORDANO | 0.552 | 0.545 |
| A. PARDY | 0.551 | 0.571 |
| C. SARICH | 0.518 | 0.528 |
| J. BOUWMEESTER | 0.517 | 0.513 |
| R. REGEHR | 0.498 | 0.495 |
| A. BABCHUK | 0.494 | 0.541 |
| S. STAIOS | 0.492 | 0.507 |
SC% is the ratio of chances for and against posted while the player was on the ice at even strength. Fenwick % is the ratio of all shots for and against while the player was on in the ice minus blocked shots. I used Fenwick rather than corsi because it’s correlation with scoring chances was slightly higher (0.689 vs. 0.668) for this sample. This is consistent with what others have found in the past, although the difference between the two possession metrics is close to negligible.
Some interesting individual outcomes. Moss led the regular skaters in terms of SC% while Rene Bourque’s awful year is well captured here. Iginla and Tanguay had better SC ratios than possession ratios, which may somewhat explain how they were able to put up very good ES scoring rates despite middling corsi rates. On the other end of things, Tom Kostopolous and Anton Babchuk underperformed their expected scoring chance ratios given some reasonably high Fenwick numbers.
Keep in mind what context is not captured here: strength of opponents, strength of team mates and starting position. All of those things moderate possession and scoring chance ratios to a non-trivial degree.
The Good News
– Giordano, Moss and Backlund killed it this season, by just about all measures.
– Jackman, as is a surprise to no one, was also well above water.
– Adam Pardy may have been injured a lot, but he takes advantage of his soft circumstances.
– Alex Tanguay and Jarome Iginla were somewhat underwhelming in terms of driving the play north this year, but they seemed to be pretty effective with their zone time. I don’t know if a player can outplay his possession rate indefinitely, but by my count the Flames big guns did so this season at least.
– Most of the team was in the black in terms of the 79 games I was able to get in the books. The Flames overall ES SC% was 51.9% (1081, 1001 against).
The Bad News
– Aside from a few outliers, the Flames SC% and fenwick% basically mirrors the diffculty of the competition each player faced. This is somewhat expected, although the club has a lot of money invested at the top-end of the roster without the concurrent bump in outcomes. Regehr and Bouwmeester, for example, are relatively poor by these measures despite costing north of $10M. To be fair, they carried the heaviest load night-in and night-out, but at that price you’d think the team would get more than treading water.
For most teams – particularly elite ones – you’ll generally find the inverse is true: the high-end players post the best SC% and possession stats and things fall away the further down the line-up you go.
– Rene Bourque was just awful. He played relatively difficult minutes all year, but that’s nothing new for the guy. He got positively roasted and was the only regular skater nowhere close to the 50% mark. If he doesn’t rebound big next season, his contract is a boat anchor.
– Given their salaries and soft circumstances, the Stajan and Hagman results aren’t terrible, but they certainly aren’t ideal either.
– This table is another word of caution when it comes to Brendan Morrison – his counting numbers were much better than all of his underlying stats this year. That’s a big red flag.
– Ditto Anton Babchuk. This is even strength results, so his abilities on the PP aren’t captured here, but it’s surprising to see how relatively poorly he comes out despite the high possession rate. Keep in mind, this was with him playing some of the easiest minutes possible at 5-on-5.
Other Stuff
– Craig Conroy didn’t play enough for his numbers to be overly meaningful, but the ratios he did manage in his limited role were nonetheless still impressive.
– Ales Kotalik’s sample was also rather small, but he wasn’t terrible by these metrics either. Note: I still don’t want him on the team next year.
– Guys like Modin, Mikkelson, Carson, etc were excluded because they didn’t even crack the 10 game mark.
This is the view from 50,000 feet and we have a lot more to look at it when it comes to this information. Later, Flamesnation plans to take a look at how combinations of players fared with and without each other. We may get into the special teams numbers as well.
Recent articles from Kent Wilson