Flames 2016-17: A tale of two seasons

By Kent Wilson
7 years agoMaking the playoffs after finishing near the bottom of the league last year is a big enough accomplishment on its own, but it seems like a minor miracle given Calgary’s dreadful start to the season.
As we all fondly recall, the Flames stumbled badly out of the gate. By the middle of November, they were deservedly ensconced as one of the very worst teams in the league. The Glen Gulutzan hire looked like a terrible misstep and it felt like the club would spend another year playing out the string and eyeing the CSS draft rankings.
But they turned things around. Most will point to the February bump and the March winning streak, but the truth is things started to pick up earlier than that. Calgary’s turnaround began in earnest in the new year, except it was hidden behind a PDO dry spell that masked the improvement.
Split half improvement
If we take a look at the underlying numbers, the difference between Calgary’s “two seasons” becomes stark:
| Team | Date | CF60 | CA60 | SF60 | SA60 | xGF60 | xGA60 | CF% | SF% | xGF% | C+/- | S+/- | xG+/- |
|---|---|---|---|---|---|---|---|---|---|---|---|---|---|
| CGY | Oct’16-Dec’16 | 54.45 | 55.73 | 28.78 | 29.15 | 2.26 | 2.54 | 49.42 | 49.68 | 47.04 | -37.68 | -10.82 | -8.37 |
| CGY | Jan’17-Mar’17 | 56.05 | 52.02 | 30.17 | 27.99 | 2.44 | 2.43 | 51.86 | 51.88 | 50.15 | 123.39 | 66.87 | 0.45 |
| Delta | 1.6 | -3.71 | 1.39 | -1.16 | 0.18 | -0.11 | 2.44 | 2.2 | 3.11 | 161.07 | 77.69 | 8.82 |
What we see here is the Flames’ first 39 games versus the next 39 games. I left out the last four games of the year to avoid polluting the numbers with some non-representative data (i.e. a handful of nothing games without the full roster). All stats are venue and score adjusted from Corsica Hockey.
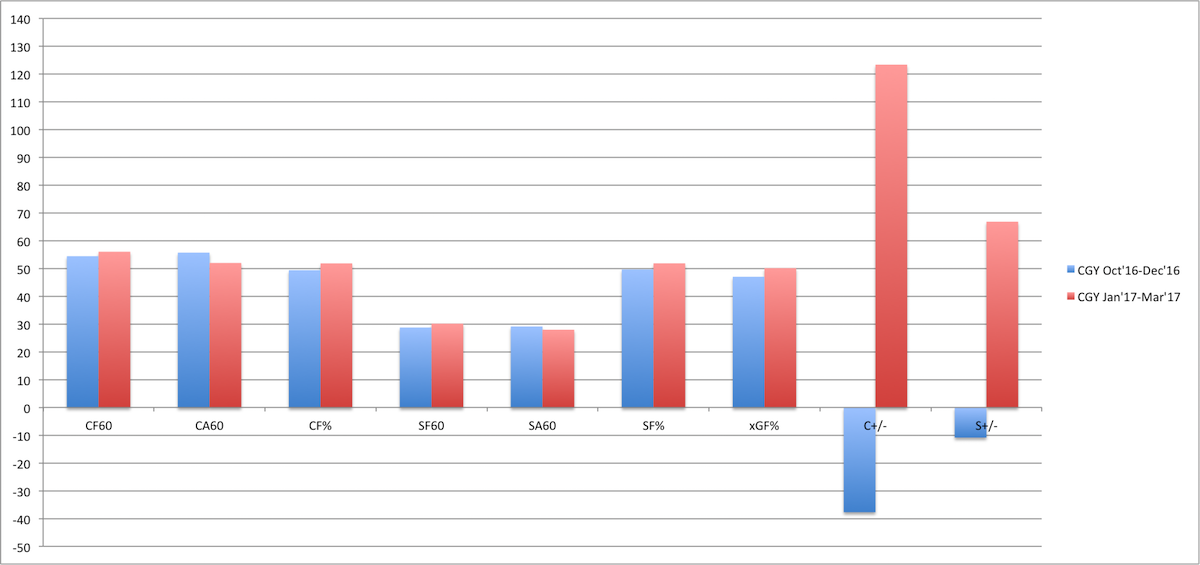
As you can see, Calgary improved at literally everything. Their shots and expected goals against went down while their shots and expected goals for went up. At the end of the table, you can see the cumulative effects of these improvements: the Flames had an (adjusted) corsi improvement of 161 and adjusted shot improvement of 78 between the first and second half.
Here’s how it looks in graph form:
By month
| Month | CF% | SF% | XGF% |
|---|---|---|---|
| OCT | 47.55 | 48.56 | 43.7 |
| NOV | 50.8 | 50.95 | 49.01 |
| DEC | 49.07 | 48.89 | 47.31 |
| JAN | 53.12 | 55.1 | 50.42 |
| FEB | 51.48 | 51.49 | 49.78 |
| MAR | 51.15 | 49.5 | 50.22 |
For added context, I broke things down by month.
As you can see, the true outlier was October. For the first month of the year, the Flames players struggled to learn the new coach’s system and the new coach struggled to figure out who to trust and how much to play everyone.
The rest of 2016 wasn’t great, but it was better than October. The switch really flipped in the new year, however. From that point on, Calgary managed the sixth best adjusted corsi ratio in the NHL (51.86%), excluding the last few nothing games. In the West, only the L.A. Kings and Chicago Blackhawks had a better adjusted possession rate than the Flames over the same period of time.
Conclusion
The Calgary Flames aren’t legitimate contenders yet, but the second half of their 2016-17 season suggests a very real step forward for the club. If Glen Guluztan and Brad Treliving can build on that improvement for 2017-18, the club should be able to join the Western Conference’s heavy hitters.
Recent articles from Kent Wilson