Summarizing the Flames, the elite and last season
By Kent Wilson
12 years ago
We wrap up the "mediocrity" series today by taking a look at some of the Flames underlying numbers against some of the best in the league. Previously Kevin Hatch investigated the Flames winning percentages against the various tiers in the league and showed us the team really struggled against the big boys – even during the hallowed second-half run (in fact, their winning percentage went down against the top-four clubs).
The Run was comprised of beating up on the NHL’s weak sisterrs. Make no mistake: that’s one of the signs of a good team. Unfourtunately, you also have to make hay against other good teams in order to be a contender of any weight. Of course, win percentage can sometimes be misleading since all sorts of things go into a ‘W’. I looked at the Flames underlying numbers against various top-end clubs from lsat year to get a sense of how things went.
| Game date | Opponent | corsi | goal diff | SC diff |
|---|---|---|---|---|
| Oct. 21 | DET | 1 | -2 | -3 |
| Oct. 24 | SJS | -3 | 4 | 12 |
| Oct.30 | WAS | 7 | -5 | -1 |
| Nov.3 | DET | -27 | -1 | -5 |
| Nov.13 | SJS | 0 | -1 | -11 |
| Nov.19 | CHI | -24 | 5 | 2 |
| Nov.26 | PHI | -1 | 1 | 2 |
| Nov.27 | PIT | -2 | -3 | 1 |
| Dec.1 | VAN | 4 | -5 | 6 |
| Dec.5 | CHI | -7 | -2 | 0 |
| Dec.7 | TBL | 0 | 2 | 1 |
| Jan.5 | VAN | 30 | -2 | 4 |
| Jan.7 | DET | 15 | 0 | 12 |
| Jan.22 | VAN | -18 | 0 | -3 |
| Feb.7 | CHI | -4 | 2 | 2 |
| Feb.12 | VAN | -2 | -2 | 4 |
| Feb.22 | BOS | 14 | -2 | -4 |
| Feb.25 | SJS | -7 | 0 | -12 |
| Mar.2 | CHI | -12 | -2 | 2 |
| Mar.12 | VAN | -7 | -1 | -4 |
| Mar.23 | SJS | -8 | -3 | -16 |
| Apr.9 | VAN | -20 | -1 | 5 |
| Total | -71 | -18 | -6 |
The chart shows games against who I consider the best in the west (VAN, DET and CHI) and some of the top-end clubs in the East (TBL, PIT, BOS, PHI). The statistical categories include corsi (shots for and against at the net at even strength), goal differential and even strength scoring chance differential (one game was missing from the data set – Chicago from December 5th).
The results jump around a bit, as is customary with single game datapoints. Some of them are also misleading due to effects like playing to score. For example, on January 5th the Vancouver Canucks jumped out to an early 2-0 lead on the Flames (including a 6-2 chance differential) and then sat back the entire game protecting the lead. The Flames ran up the shot and chance count as a result. The opposite is true of the Nov.19 contest against the Blackhawks. Marty Turco was awful in that gane and the Flames played with the lead most of the night (inevitably winning 7-2). The chasing Blackhawks augemnted their chance and shot counts as a result. Limiting things to score-tied results would have been more instructive, but the tools we have for that kind of investigation are blunt and cumbersome. It’s possible, so I may drill down a bit more when I have some times on my hands
Some of the results are truly indicative, however, and the overall trends are clear: Calgary is underwater across the board. Somewhat consoling is the fact they weren’t grossly overwhlemed in terms of scoring chances (although I’m guessing the missing game would have added to the deficit a tad). That said, even with two blow-outs to their credit (one vs. Chicago and one versus San Jose earlier in the year), Calgary still ended up on the wrong side of things from all angles.
Conclusion
The findings probably aren’t revelatory given where the team has finished the last two seasons. That said, we began this inquiry for a reason: the Flames were one of the hottest teams in the league for a large portion of the year and many of their stats weren’t merely average, but excellent:
The team finished top-10 in terms of total offense with 241 goals for and top-10 in terms of goals for at even strength (163 GF). After stumbling out of the gate, the Flames PP also finished in the top-third of the league (19.5%). Calgary’s offense wasn’t merely smoke-and-mirrors. The Flames were one of the better outshooting teams, in part because they limited the opposition to 28.5 shots against per night on average – the fourth best rate in the NHL.
As such, discovering why the Flames finished 10th in the west – despite some decidedly good outcomes – struck me as worthwhile. Here’s what we discovered:
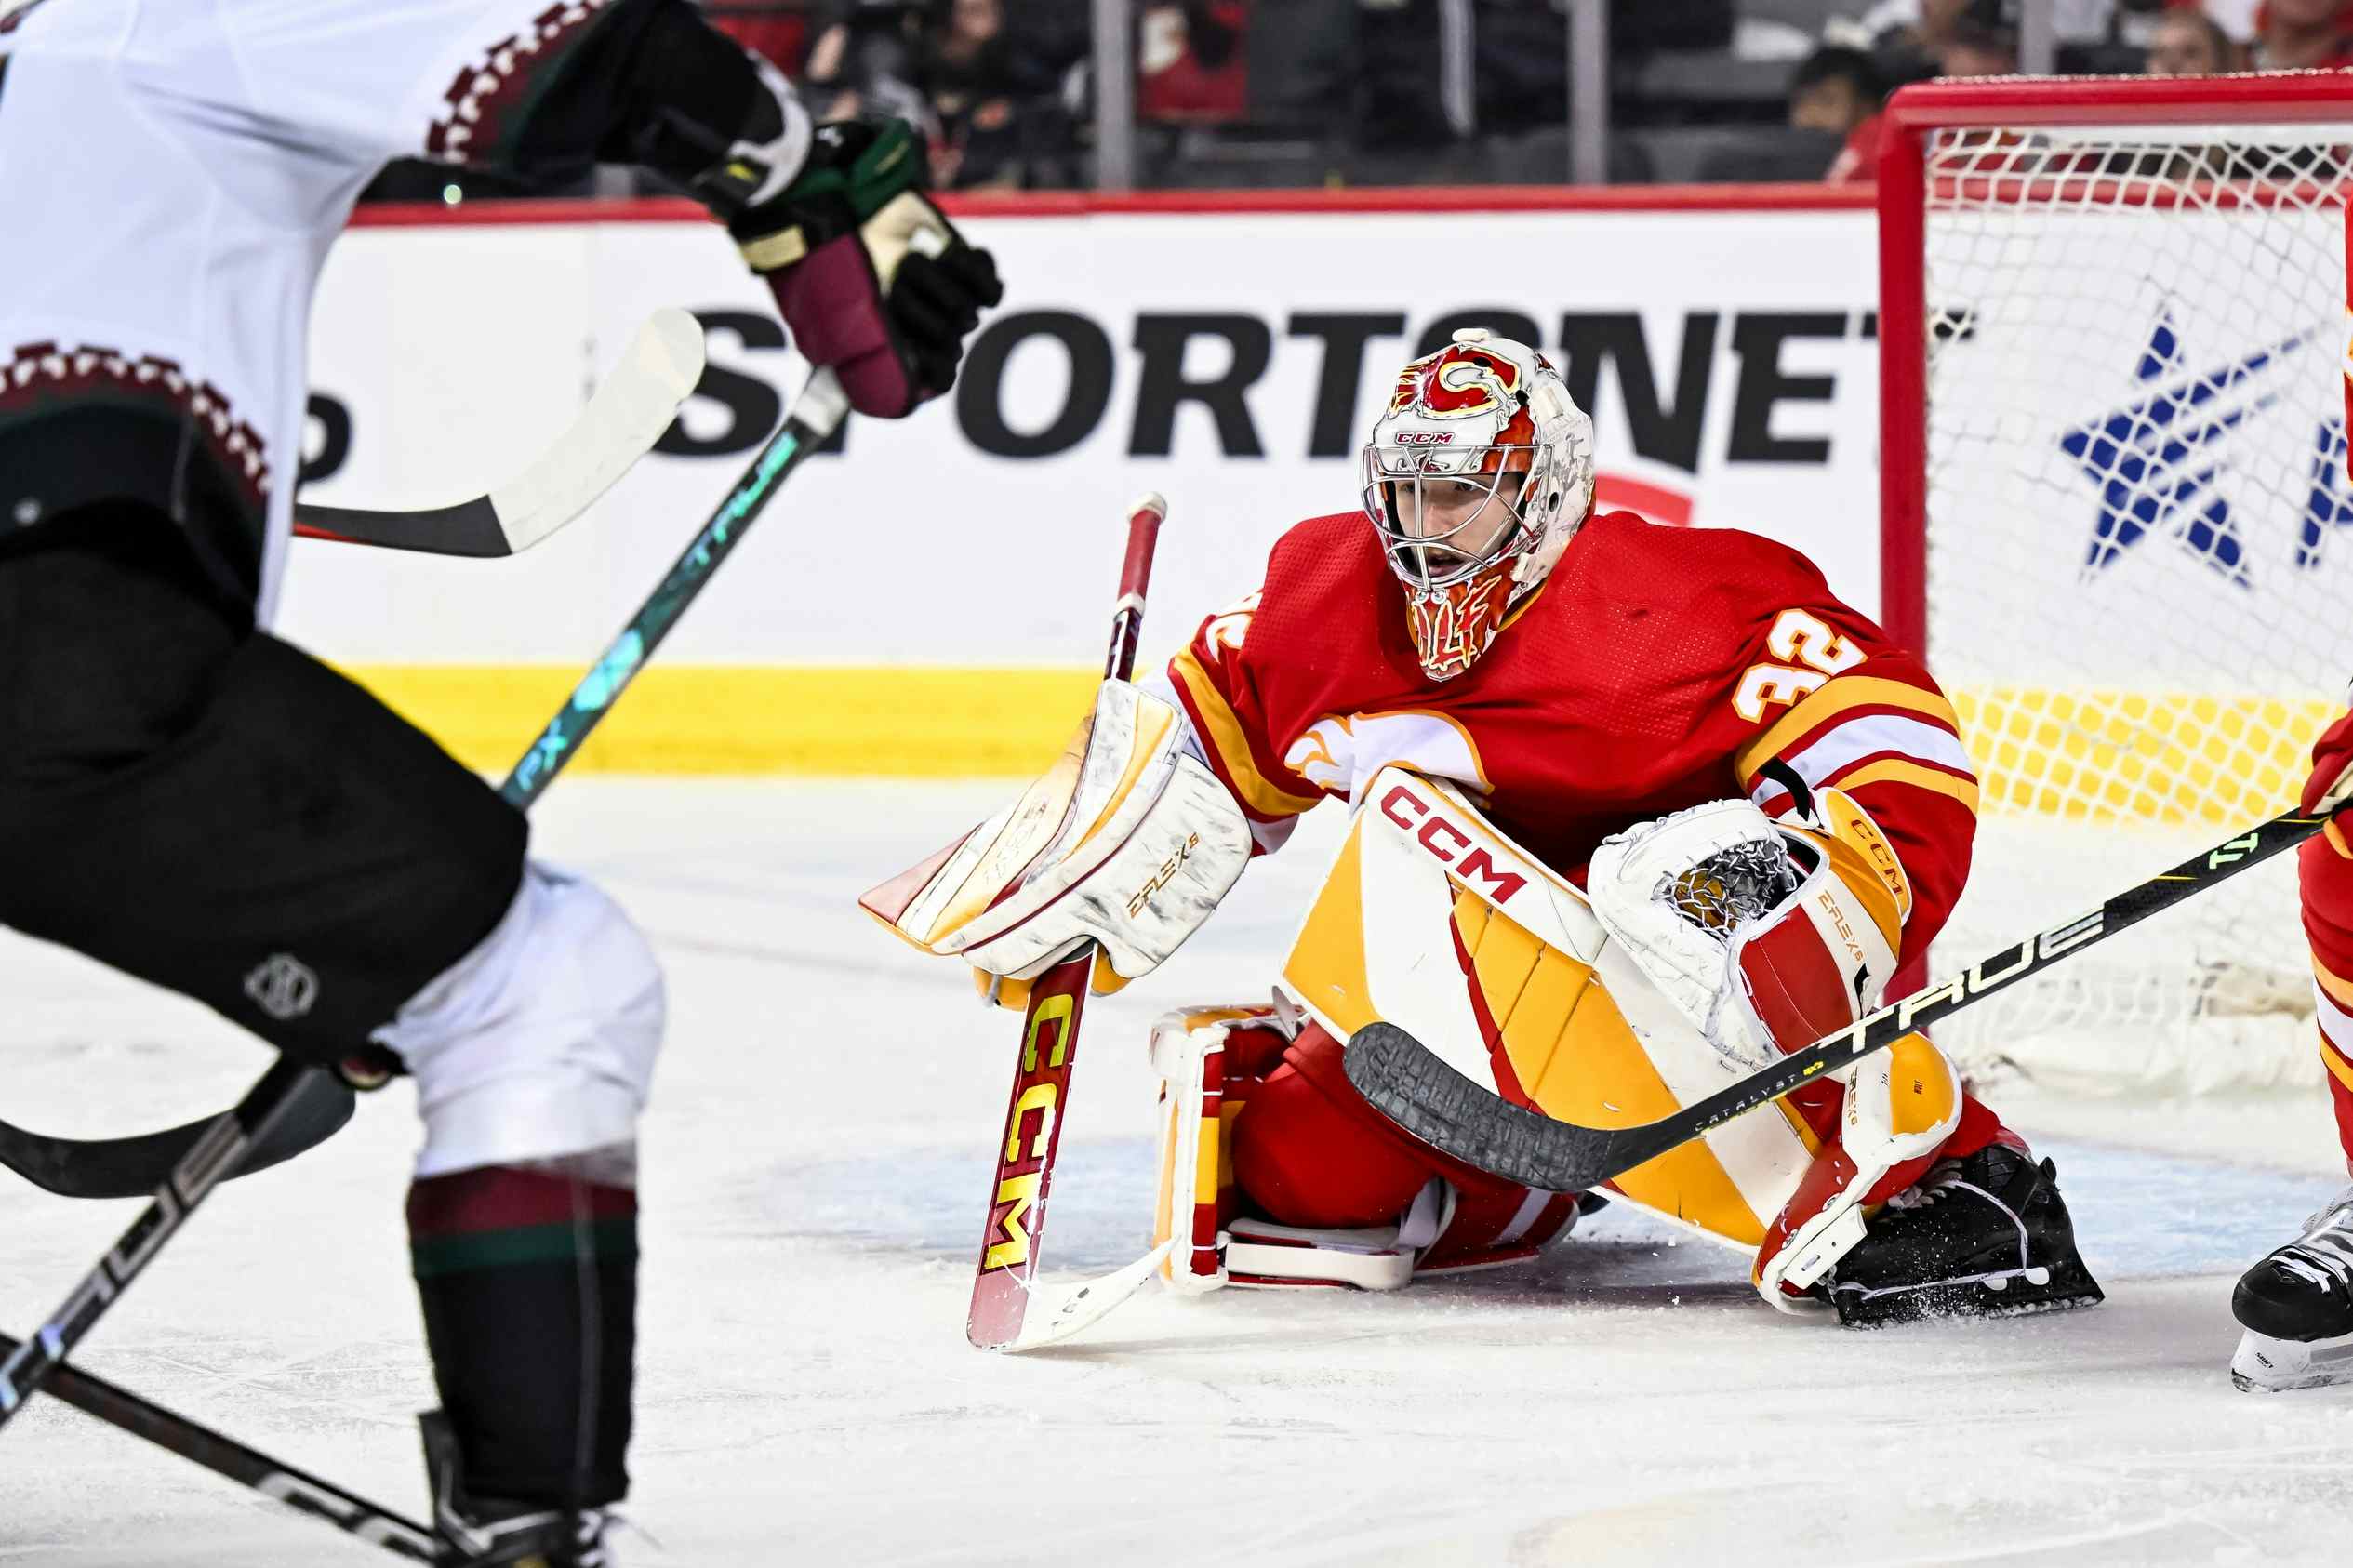
The weakest link – Miikka Kiprusoff was below average in terms of stopping pucks last year, particularly at even strength. Even Corey Crawford, Sergei Bobrovsky and Devan Dubnyk had better ES SV%. What’s more, Kipper was even worse with the score tied – the relentlessly average Steve Mason was superior to Kipper in that game state, for example.
This is why Kipper finished the year with the lowest GVT (golas versus threshold) of his time in Calgary (-2.1). That suggests Kipper was below replacement level for the Flames last year. An average season from the netminder would have put the Flames in the playoffs. A vintage Kipper season would have put them in the top-4 in the West.
Flames and the inverted pyramid – Calgary’s money/top-six players are actually the worst on the team in terms of driving possession at even strength. Anyone who consistently played against top-six opposition last year was either at or below .500 in terms of their shots ratio, specifically with the score tied. Calgary’s impressive outshooting and decent overall possession numbers are mostly drvien by their better than average middle rotation (Tim Jackman, Mikael Backlund, David Moss, Curtis Glencross, etc). The lack of Daymond Langkow and Rene Bourque falling of a cliff exacerbated the problems at the top of the rotation as well.
This is actually the reverse of most elite teams in the league, who are often carried by their best/most expensive skaters. Examples include Detroit and San Jose.
The Run – As a result of less than great goaltending and an inability to match elite vs elite skaters, the Flames struggled mightily against the best in the league, even when they were one of the hottest clubs going.
Things lined up well for the Flames in the second half: Iginla and Tanguay were white hot by the end of the year, Curtis Glencross had the best 5-6 weeks of his life, David Moss was suddenly a first line center, Mikael Backlund took a big step forward, Kipper started stopping more pucks, the PP went from a bottom-third to top-third unit…and the Flames still couldn’t match the up against the upper echelon. It shows just how tough it is to take that "next step".
That said, there are some things to be optimistic about. In our next series of posts, we’ll look at some of the reasons to look forward to 2011-12.
Recent articles from Kent Wilson

