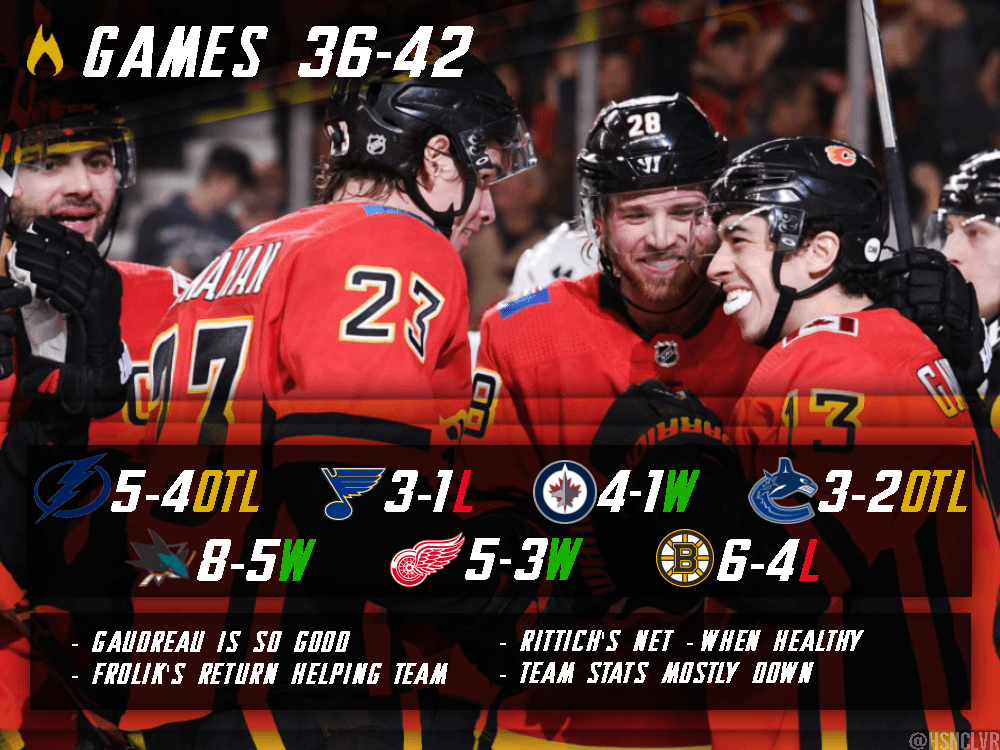
Flames in seven games: 3-2-2 in season’s sixth segment

By Ari Yanover
5 years agoIt took six seven-game segments this season for the Flames to finally fail to get a clear win. Well, it was a good run.
In their first seven-game segment, they were 4-3-0. In their second, they improved to 4-2-1. In their third, they were once again 4-3-0. In their fourth, they improved to 5-1-1. In their fifth, they kept it up with a 5-2-0. Their sixth is the first time they haven’t won at least four games – but they did finish just over 0.500 in points percentage, so that’s something.
Underlying numbers via Corsica and Natural Stat Trick.
Team stats
Now at 25-13-4, the Flames are near the top of the league in several categories, including the standings. Despite this relatively poor stretch, they’re still performing well overall. They have a 0.643 winning percentage through the season so far, down from their previous 0.657. It has them fifth in the NHL, second in the Western Conference, and first in the Pacific Division – something that has not changed from the previous segment.
- Their goals for per game is 3.57, up from their earlier 3.49. They’re third overall in the NHL, and first among all Western Conference teams and the Pacific Division.
- Their goals against per game is 2.83, up from their previous 2.69. They’re tied for ninth in the NHL, sixth among Western Conference teams, and second in the Pacific Divison.
- Their goal differential is +29, up from +27. It has them third in the NHL, and first among Western Conference teams and the Pacific Division.
- Their powerplay is at 21.2%, down from their earlier 22.6%. It’s 13th in the NHL. They’re sixth in the Western Conference, and third in the Pacific Division.
- Their penalty kill is at 78.5%, down from their earlier 79.8%. It’s 19th in the NHL. They’re 10th in the Western Conference, and fifth in the Pacific Division.
- At 9:19 penalty minutes per game, they’ve taken more infractions, up from 8:56 earlier. They’re 22nd when it comes to penalties taken in the NHL, ninth in the Western Conference, and fifth in the Pacific Division.
- Their 5v5 CF/60 is 58.64, down from their previous 59.24. It’s the eighth highest in the NHL, fourth among Western Conference teams, and third in the Pacific Divison.
- Their 5v5 CA/60 is 51.97, up a little from their previous 51.68. It’s the second lowest in the NHL, and among Western Conference and Pacific Division teams.
- Their 5v5 CF is 53.02%, down a little from their previous 53.41%. It’s the sixth highest in the NHL, fourth among Western Conference teams, and third in the Pacific Division.
- Their 5v5 shooting percentage is 8.24%, up from 7.89%. It’s tied for 13th in the NHL.
- Their 5v5 save percentage is 91.52%, down a little from 91.83%. It’s tied for 20th in the NHL.
- Their PDO is 99.76, up a little from 99.72. It’s 19th in the NHL.
So, what’s changed?
The Flames are scoring more, but that has more to do with their shooting percentage going up than anything else. And while they continue to do a good job at limiting corsi events against, they’re surrendering more goals: Mike Smith gave up 11 in three starts, while David Rittich surrendered 13 in four starts (with nine coming from the Lightning and the Sharks: one of the few teams better than them in the standings, and one of the few teams better than them primarily regarding underlying numbers). Rittich looked human against some top talent, while two of Smith’s three starts came against two of the worst teams in the NHL.
There is some cause for concern over this stretch, as the Flames’ numbers have almost exclusively worsened over the past seven games. However, standings-wise, they’ve pretty much treaded water: they’re still ahead of many of the teams chasing them, albeit perhaps by less comfortable margins. They weathered this storm, but that doesn’t guarantee anything if things continue to go wrong.
Player stats
First, the forwards (all situations, ordered by ice time).
Game scores courtesy of our very own Ryan Pike: 0.950 and above is considered great; 0.450-0.950 good; 0.150-0.450 fine; -0.150-0.150 bad; under -0.150 awful.
| Player | TOI | Goals | Points | P/60 | SH% | CF% | GF% | OZS% | Game score |
| Lindholm | 864:06 | 20 | 48 | 3.33 | 19.23 | 58.65 | 64.62 | 54.55 | +1.282 |
| Gaudreau | 861:07 | 23 | 61 | 4.25 | 16.55 | 61.67 | 68.97 | 67.49 | +1.590 |
| Monahan | 832:48 | 22 | 51 | 3.67 | 17.05 | 61.23 | 65.81 | 69.53 | +1.368 |
| Tkachuk | 743:52 | 18 | 47 | 3.79 | 18.00 | 61.74 | 69.32 | 68.27 | +1.191 |
| Backlund | 703:40 | 9 | 21 | 1.79 | 9.68 | 53.85 | 56.06 | 50.64 | +0.797 |
| Neal | 629:10 | 4 | 8 | 0.76 | 4.49 | 56.01 | 42.22 | 63.40 | +0.334 |
| Bennett | 555:19 | 6 | 13 | 1.40 | 8.57 | 55.75 | 53.19 | 59.79 | +0.512 |
| Ryan | 549:28 | 4 | 12 | 1.31 | 10.00 | 50.82 | 40.91 | 45.37 | +0.337 |
| Jankowski | 469:04 | 6 | 17 | 2.17 | 11.76 | 45.73 | 50.00 | 45.09 | +0.393 |
| Hathaway | 369:01 | 4 | 5 | 0.81 | 13.79 | 39.58 | 40.00 | 49.60 | +0.136 |
| Frolik | 301:33 | 9 | 11 | 2.19 | 19.57 | 53.02 | 55.56 | 52.78 | +0.660 |
| Czarnik | 261:34 | 2 | 6 | 1.38 | 6.45 | 54.62 | 34.78 | 58.51 | +0.335 |
| Dube | 227:58 | 1 | 5 | 1.32 | 4.55 | 48.10 | 56.25 | 64.04 | +0.227 |
| Quine | 85:03 | 3 | 4 | 2.82 | 50.00 | 48.91 | 57.14 | 52.00 | +0.327 |
| Mangiapane | 80:43 | 3 | 0 | 0 | 0 | 49.28 | 0.00 | 65.63 | +0.023 |
| Lomberg | 27:55 | 0 | 0 | 0 | 0 | 27.27 | n/a | 55.56 | -0.244 |
| Rychel | 18:21 | 0 | 0 | 0 | 0 | 36.36 | 50.00 | 40.00 | -0.268 |
| Peluso | 16:27 | 0 | 0 | 0 | 0 | 48.15 | 0.00 | 25.00 | -0.019 |
The Flames’ top forwards have been obvious all season, but as of late, Jonny Gaudreau has taken things to a whole other level. He’s starting to pull away from his counterparts in pretty much every stat, and it’s showing up on the scoreboard. Sean Monahan, Elias Lindholm, and Matthew Tkachuk are all still playing rather well – and the four of them continue to have pretty high shooting percentages, so this perhaps isn’t something we can continue to expect (Gaudreau’s shooting percentage in particular has increased over this offensive spurt) – but they just aren’t as good as Gaudreau.
Mikael Backlund easily remains the Flames’ fifth best forward, while a now healthy Michael Frolik is back to make a case as the sixth (although, speaking of suspiciously high shooting percentages…). Otherwise, it’s a couple of other Flames first rounders starting to see some spikes in their performance: Sam Bennett got the Backlund Bump a while back, and now Mark Jankowski is starting to get up there (likely a fair bit to do with his penalty killing prowess).
Derek Ryan is dropping a bit, while James Neal has been an enigma all season, though at least his shooting percentage finally got a tiny bit healthier (it’s still bad, though, and helps explain the ever-continuing disparity between his corsi and actual goals for). The rest (that are still up in the NHL, at least) are mostly inoffensive depth.
The Flames’ most common line combinations at 5v5 have been:
| Gaudreau | Monahan | Lindholm |
| Tkachuk | Backlund | Bennett |
| Tkachuk | Backlund | Frolik |
The Flames’ most-used lines have been consistent for a while now, which is kind of odd, considering how they feature two different right wingers for Tkachuk and Backlund. Frolik’s return might shake things up for the next segment, though. And you’ve gotta keep thinking that top line isn’t going anywhere – it’s the third most played line across the entire NHL.
Now, the defence (all situations, ordered by ice time):
| Player | TOI | Goals | Points | P/60 | SH% | CF% | GF% | OZS% | Game score |
| Giordano | 988:57 | 6 | 39 | 2.37 | 5.61 | 56.42 | 65.63 | 51.24 | +1.094 |
| Brodie | 910:58 | 4 | 15 | 0.99 | 7.02 | 51.96 | 55.29 | 48.77 | +0.568 |
| Hanifin | 876:40 | 3 | 21 | 1.44 | 4.23 | 53.66 | 50.56 | 49.65 | +0.589 |
| Hamonic | 699:30 | 3 | 11 | 0.94 | 4.48 | 50.15 | 51.14 | 39.68 | +0.648 |
| Andersson | 583:52 | 1 | 4 | 0.41 | 2.08 | 48.57 | 52.38 | 59.66 | +0.162 |
| Valimaki | 331:58 | 1 | 2 | 0.36 | 4.35 | 47.80 | 34.62 | 64.71 | +0.172 |
| Kylington | 213:16 | 1 | 2 | 0.56 | 16.67 | 48.68 | 44.44 | 60.00 | +0.072 |
| Stone | 176:18 | 0 | 4 | 1.36 | 0 | 48.09 | 35.00 | 50.88 | +0.364 |
| Prout | 57:55 | 0 | 0 | 0 | 0 | 52.73 | 33.33 | 57.89 | +0.071 |
This wasn’t a great seven-game segment for the defensive group, but as usual, Mark Giordano is heads and shoulders above the rest. Travis Hamonic continues to perform pretty well as a mostly defensive defender, while both Noah Hanifin and TJ Brodie continue to be solid partners for a top four that, overall, is working pretty well, though they certainly haven’t had their best games as of late.
Rasmus Andersson sure has gotten a lot of minutes for someone who didn’t make the team out of camp, hasn’t he? He’s holding on well enough for a rookie getting relatively limited minutes, while Oliver Kylington is a bit worse for the wear – though he’s getting way more minutes than expected, as well. At this stage, the Flames are hanging on well enough to tolerate any rookie hiccups; the top four’s little slump is probably of a more pressing concern.
And finally, goalies (all situations):
| Player | TOI | SV% | ldSV% | mdSV% | hdSV% | Game score |
| Smith | 1281:37 | 88.58 | 95.90 | 89.89 | 75.64 | +0.096 |
| Rittich | 1229:55 | 92.03 | 96.48 | 93.49 | 81.94 | +0.863 |
Rittich is catching up to Smith in overall minutes played, and likely would have passed him by now if it weren’t for his day-to-day injury. He’s also still unquestionably the better goaltender: while both goalies’ numbers have dropped some, Smith’s weren’t in great position to begin with.
It’s encouraging, though, that Rittich’s numbers haven’t dropped by much, even as he’s faced some of the toughest opponents the NHL has to offer and as he’s continued to strive as a starter in the best league in the world.
Recent articles from Ari Yanover