Flames in seven games: 6-1-0 in fifth segment

By Ryan Pike
4 years agoThe Calgary Flames have completed 35 games of the 2019-20 regular season calendar. They’re 42.7% of the way through their season, and so we continue the fine tradition of examining their performances in bite-sized seven game morsels. In the first segment of this season, they went 3-3-1. In their second segment, they went 3-3-1. In their third segment, they went 4-2-1. In their fourth segment, they went 2-4-1.
In their fifth segment, they went 6-1-0.
Underlying numbers via Natural Stat Trick.
Game by game
(Percentage stats in this table are 5v5.)
| Date | Opponent | Result | CF% | SC% | HDSC% | PP | PK |
| Nov. 30 | Senators (vs) | 3-1 W | 51.0 | 52.0 | 56.5 | 1-for-3 | 1-for-1 |
| Dec. 5 | Sabres (vs) | 4-3 W | 57.0 | 68.9 | 71.4 | 1-for-2 | 7-for-8 |
| Dec. 7 | Kings (vs) | 4-3 W | 47.7 | 50.0 | 64.3 | 1-for-4 | 1-for-3 |
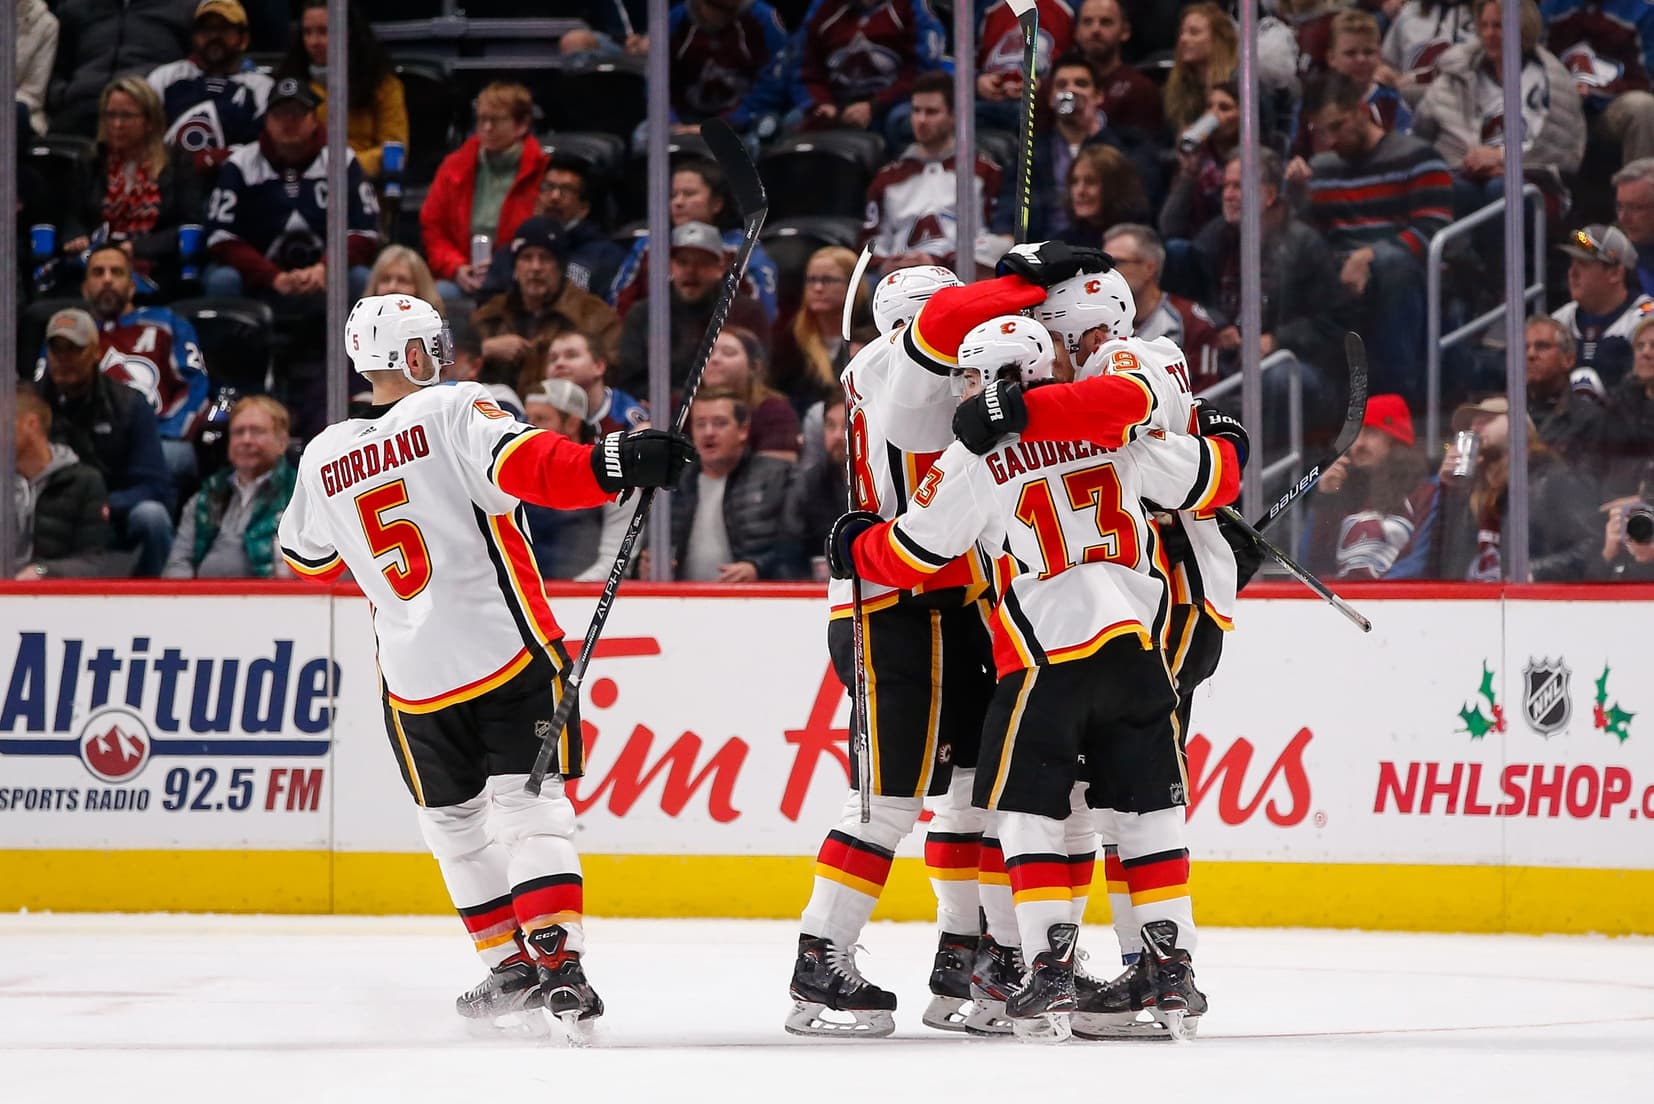
| Dec. 9 | Avalanche (@) | 5-4 OTW | 40.8 | 36.2 | 33.3 | 1-for-3 | 2-for-2 |
| Dec. 10 | Coyotes (@) | 5-2 W | 37.1 | 36.0 | 55.0 | 1-for-3 | 0-for-1 |
| Dec. 12 | Maple Leafs (vs) | 4-2 W | 51.0 | 45.6 | 47.6 | 0-for-1 | 3-for-3 |
| Dec. 14 | Hurricanes (vs) | 4-0 L | 46.9 | 49.0 | 40.0 | 0-for-5 | 3-for-4 |
The Flames played five games at home (4-1-0) and two on the road (2-0-0). For those who like to keep track, the Flames had five wins and one loss in regulation, and went to overtime once (winning the lone trip to extra time).
The Flames out-chanced the opposition three times and generated more high danger chances than the opposition four times. They scored five power play goals and allowed five. They also switched coaches, with Geoff Ward officially taking over as interim coach prior to the first game.
With 40 points thus far, the Flames are performing right on target; four wins per segment translates to precisely 40 points over 35 games (and to 94 points over a full season). Despite their pretty wild swings to this point, the Flames are on pace to be firmly in the playoff picture if they keep winning four out of every seven games.
Team stats
The Flames have an 18-13-4 record through their first 35 games, rebounding nicely in this segment from a pretty ugly previous seven games. The Ottawa and Buffalo games were very strong, but weren’t quite perfect – but for a team that hadn’t played a rock-solid 60 minutes to that point, they were massive improvements. They’ve held leads more frequently in the past, slipping to second in the NHL in time spent trailing.
- Their goals for per game is 2.63, up from 2.39. They’re 24th overall in the NHL and 11th in the Western Conference.
- Their goals against per game is 2.97, down from 3.04. They’re 15th in the NHL, and 9th in the Western Conference.
- Their goal differential is -9, up from -16. They’re 23rd in the NHL, and 11th in the Western Conference.
- Their power play is at 17.4%, up from 15.9%. They’re 18th in the NHL, and 7th in the Western Conference.
- Their penalty kill is at 83.8%, down from 85.3%. It’s 9th in the NHL and 6th in the Western Conference.
- They’ve taken 9.3 minutes of penalties per game, down from 9.4. That’s 8th-most in the NHL, and 3rd-most in the Western Conference.
- Their 5v5 CF/60 is 58.61, down from 59.30. It’s the 6th highest in the NHL, and 3rd among Western Conference teams.
- Their 5v5 CA/60 is 56.95, up from 55.22. It’s the 23rd lowest in the NHL, and 11th lowest among Western Conference teams.
- Their 5v5 CF is 50.7%, down from 51.8%. It’s the 10th highest in the NHL, and 4th among Western Conference teams.
- Their 5v5 shooting percentage is 6.93%, up from 5.93%. It’s 28th in the NHL.
- Their 5v5 save percentage is 91.84%, up from 91.18%. It’s 17th in the NHL.
- Their PDO is 0.988, up from 0.971. It’s 24th in the NHL.
After winning twice in the prior segment, the Flames won six times. They’re a little bit worse in shot attempt suppression and generation, but (as we noted elsewhere) they’re improved in locking down their high danger scoring chances. (They’re still one of the top teams at shot generation.) One of the big changes is quite simple: their puck luck has improved at both ends of the ice, and their team shooting percentage is still way below league average. It could easily continue to regress to the mean in future segments.
As has been the story all season, the things that consistently work well are their goaltending and their penalty kill. Their five on five play remains a work in progress.
Player stats
First, the forwards (all situations, ordered by ice time).
Game scores: 0.950 and above is considered great; 0.450-0.950 good; 0.150-0.450 fine; -0.150-0.150 bad; under -0.150 awful.
| Player | TOI | Goals | Points | P/60 | SH% | CF% | GF% | OZFO% | Game score |
| Lindholm | 688:07 | 14 | 23 | 2.01 | 16.9 | 51.9 | 47.0 | 54.8 | 0.642 |
| Gaudreau | 672:58 | 9 | 26 | 2.32 | 8.9 | 57.1 | 54.2 | 68.6 | 0.759 |
| Backlund | 641:10 | 3 | 14 | 1.31 | 4.2 | 49.7 | 50.9 | 51.7 | 0.397 |
| Monahan | 638:24 | 10 | 28 | 2.63 | 11.5 | 55.3 | 51.9 | 67.4 | 0.689 |
| Tkachuk | 624:16 | 12 | 27 | 2.59 | 13.2 | 58.7 | 57.4 | 63.9 | 0.859 |
| Ryan | 512:46 | 5 | 17 | 1.99 | 8.9 | 46.5 | 59.0 | 41.2 | 0.455 |
| Lucic | 430:51 | 3 | 8 | 1.11 | 6.7 | 54.9 | 48.6 | 52.5 | 0.245 |
| Mangiapane | 419:00 | 6 | 10 | 1.43 | 14.6 | 53.3 | 53.6 | 48.3 | 0.420 |
| Frolik | 393:30 | 4 | 8 | 1.22 | 10.8 | 47.5 | 28.1 | 46.2 | 0.221 |
| Jankowski | 339:13 | 0 | 1 | 0.18 | 0.0 | 44.3 | 16.0 | 28.2 | 0.085 |
| Rieder | 289:10 | 2 | 5 | 1.04 | 5.6 | 45.8 | 23.8 | 37.9 | 0.265 |
| Bennett | 263:53 | 3 | 5 | 1.14 | 8.1 | 55.1 | 62.5 | 57.5 | 0.328 |
| Dube | 160:36 | 3 | 7 | 2.62 | 21.4 | 45.5 | 60.0 | 43.2 | 0.384 |
| Quine | 88:15 | 1 | 1 | 0.68 | 8.3 | 51.6 | 33.3 | 49.1 | 0.179 |
| Czarnik | 81:30 | 2 | 3 | 2.21 | 22.2 | 54.6 | 75.0 | 58.9 | 0.394 |
| Rinaldo | 41:43 | 2 | 3 | 4.31 | 33.3 | 50.0 | 60.0 | 47.6 | 0.560 |
Backlund and Gaudreau are obviously punching below their weights offensively, as they’re shooting just 4.2% and 8.9% respectively. Eventually, those percentages should rebound. Eventually.
The team’s top four continues to be what drives them: Gaudreau, Monahan, Tkachuk and Lindholm. Performance-wise, we’re seeing Mangiapane and Ryan leading the charge among the remainder of the forwards, followed closely by Backlund and Dube.
The fourth line has improved somewhat performance-wise, but Jankowski still lags well behind Rieder and Frolik by most metrics.
It’s unclear precisely how everybody will be deployed once Czarnik and Bennett return to action, but keep an eye on whether Ward bundles the stronger players together or continues to keep them spread out across multiple lines.
The Flames’ most common line combinations at 5v5 remain:
| Gaudreau | Monahan | Lindholm |
| Tkachuk | Backlund | Mangiapane |
| Tkachuk | Backlund | Frolik |
Now, the defence (all situations, ordered by ice time):
| Player | TOI | Goals | Points | P/60 | SH% | CF% | GF% | OZFO% | Game score |
| Giordano | 853:04 | 4 | 17 | 1.22 | 5.3 | 49.5 | 48.9 | 50.0 | 0.640 |
| Hanifin | 756:33 | 3 | 8 | 0.69 | 5.7 | 49.3 | 40.7 | 45.8 | 0.315 |
| Andersson | 685:01 | 2 | 10 | 0.87 | 3.6 | 55.8 | 50.9 | 61.3 | 0.481 |
| Hamonic | 612:06 | 2 | 7 | 0.50 | 3.0 | 42.3 | 34.9 | 33.4 | 0.348 |
| Brodie | 578:30 | 1 | 10 | 1.34 | 4.4 | 48.6 | 50.0 | 46.8 | 0.345 |
| Kylington | 328:57 | 0 | 3 | 0.43 | 0.0 | 52.0 | 45.8 | 63.0 | 0.222 |
| Stone | 275:21 | 1 | 3 | 0.56 | 5.6 | 41.7 | 42.9 | 45.7 | 0.147 |
| Davidson | 40:37 | 0 | 0 | 0.00 | 0.0 | 56.5 | 20.0 | 55.6 | 0.367 |
The good news is the gap between Giordano and everybody else has closed a little bit, a product of Ward playing the top pairing a little bit less than his predecessor. But the 36-year-old has still played a ton.
Performance-wise, Giordano remains the undisputed top dog but Andersson has emerged as the best of the secondary group thus far. The blueline has a pretty solid and reliable top five, with only a slight drop-off to Kylington as the six. Honestly, aside from a lack of defensive help from the forwards on breakouts, the seven regular blueliners have done admirable work.
And finally, goalies (all situations):
| Player | TOI | SV% | ldSV% | mdSV% | hdSV% | Game score |
| Rittich | 1628:01 | .914 | .968 | .882 | .847 | 0.831 |
| Talbot | 491:19 | .907 | .952 | .914 | .769 | 0.594 |
Rittich continues to play a lot, but he’s been quite good. His high danger performance has improved from last segment and he’s nearly automatic on low danger chances. Talbot has played a much smaller amount and he’s a bit worse than Rittich, but the gap isn’t massive and he’s been a very reliable backup option.
Recent articles from Ryan Pike


