Flames in seven games: 6-0-1 in season’s ninth segment

By Ari Yanover
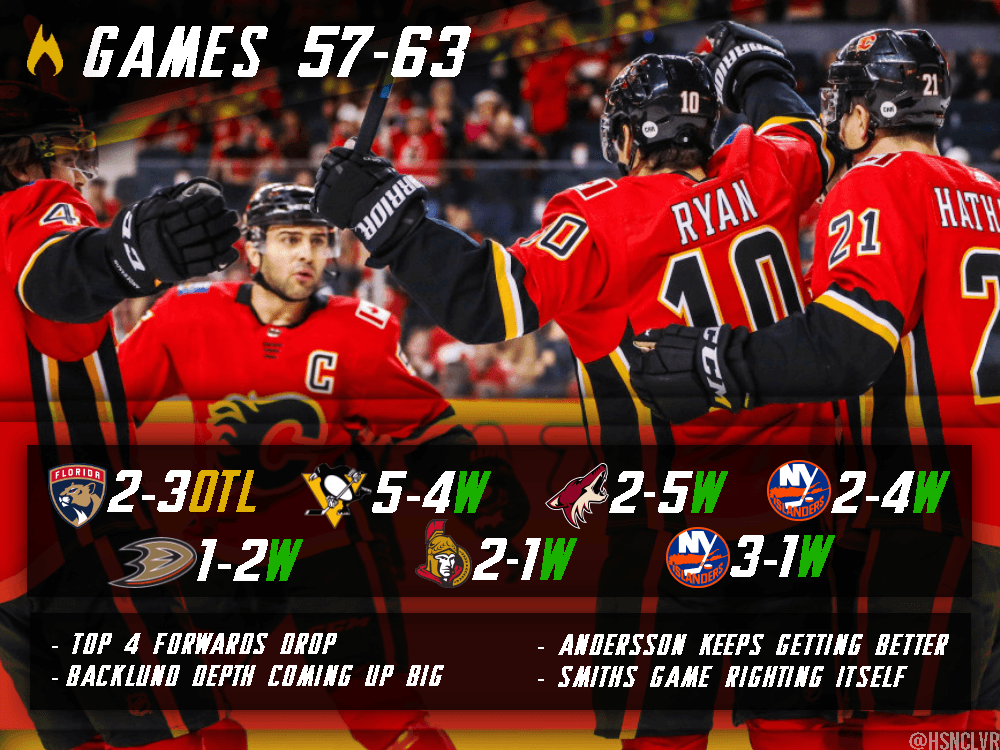
5 years agoThe Flames came back from the all-star break looking not great. They went on a four-game losing streak, posting their worst seven-game outing to date. And now they’ve won six in a row and counting, so…
In their first seven-game segment, they were 4-3-0. In their second, they improved to 4-2-1. In their third, they were once again 4-3-0. In their fourth, they improved to 5-1-1. In their fifth, they kept it up with a 5-2-0. In the sixth, they fell to 3-2-2. In the seventh, they shot up to 6-0-1. In the eighth, they plummeted to 3-3-1. The last time they failed to win four games in a seven-game stretch, though, they jumped out to a 6-0-1 streak and… well, here we are again.
Underlying numbers via Natural Stat Trick.
Team stats
Now at 40-16-7, the Flames have created a bit of separation between themselves and the other non-Lightning top teams, though just a bit. They have a 0.690 points percentage through the season so far, up from their previous 0.661. It has them second in the NHL, and first in the Western Conference and Pacific Division.
- Their goals for per game is 3.62, down a little from their earlier 3.66. They’re second overall in the NHL, and first among all Western Conference teams and the Pacific Division.
- Their goals against per game is 2.81, down from their previous 2.93. They’re eighth in the NHL, fourth among Western Conference teams, and first in the Pacific Divison.
- Their goal differential is +47, up from +38. It has them second in the NHL, and first among Western Conference teams and the Pacific Division.
- Their powerplay is at 22.1%, down a little from their earlier 22.9%. It’s 10th in the NHL. They’re fifth in the Western Conference, and second in the Pacific Division.
- Their penalty kill is at 79.1%, the same as before. It’s tied for 21st in the NHL. They’re tied for 10th in the Western Conference, and sixth in the Pacific Division.
- At 8:58 penalty minutes per game, they’ve taken fewer infractions, down from 9:07 earlier. They’re 20th when it comes to penalties taken in the NHL, 10th in the Western Conference, and fifth in the Pacific Division.
- Their 5v5 CF/60 is 59.54, up from their previous 58.68. It’s the seventh highest in the NHL, fourth among Western Conference teams, and third in the Pacific Division.
- Their 5v5 CA/60 is 53.29, down a little from their previous 53.31. It’s the fifth lowest in the NHL, and third lowest among Western Conference and Pacific Division teams.
- Their 5v5 CF is 52.77%, up a little from their previous 52.40%. It’s the fifth highest in the NHL, and third among Western Conference and Pacific Division teams.
- Their 5v5 shooting percentage is 8.85%, up a little from 8.71%. It’s eighth in the NHL.
- Their 5v5 save percentage is 91.99%, up from 91.73%. It’s tied for 13th in the NHL.
- Their PDO is still 100.08, up a little from their previous 100.04. It’s sixth in the NHL.
So, what’s changed?
The Flames have kept up their goal-scoring pace – which remains among the best in the NHL – getting depth contributions as of late. More significantly, though, they’ve given up fewer goals. They surrendered four to the Penguins during this segment, but otherwise, haven’t given up more than two through 65 minutes of play. We’re seeing this in their goal differential as well: it’s right at the top of the league.
While the Flames have completely turned their powerplay around from last season, though, it’s a little odd to see their penalty kill consistently in the bottom third of the NHL. Special teams haven’t cost them nearly as much this season as they did last, though.
If you’re looking for red flags, then their PDO has you covered. The Flames are getting one of the best shooting percentages in the NHL right now, and combined with goaltending slightly above the median, things that aren’t necessarily in their control are tilting very much in their favour – a sign that things could start going wrong once again. To counter that, though, is the fact that the Flames have consistently been good at generating shot attempts and preventing them all season long. They’re in a great stretch right now, but they’ve been good all year.
Player stats
First, the forwards (all situations, ordered by ice time).
Game scores courtesy of our very own Ryan Pike: 0.950 and above is considered great; 0.450-0.950 good; 0.150-0.450 fine; -0.150-0.150 bad; under -0.150 awful.
| Player | TOI | Goals | Points | P/60 | SH% | CF% | GF% | OZS% | Game score |
| Lindholm | 1280:30 | 25 | 71 | 3.33 | 16.45 | 55.91 | 63.64 | 52.66 | +1.201 |
| Gaudreau | 1270:43 | 30 | 80 | 3.78 | 15.38 | 59.82 | 66.46 | 68.33 | +1.396 |
| Monahan | 1229:21 | 29 | 68 | 3.32 | 16.20 | 59.56 | 63.98 | 69.32 | +1.193 |
| Tkachuk | 1109:10 | 25 | 60 | 3.25 | 16.23 | 61.62 | 67.44 | 66.23 | +1.093 |
| Backlund | 1055:03 | 17 | 38 | 2.16 | 11.33 | 53.84 | 59.43 | 48.97 | +0.846 |
| Neal | 826:10 | 5 | 15 | 1.09 | 4.10 | 54.95 | 49.18 | 64.58 | +0.408 |
| Bennett | 825:18 | 11 | 24 | 1.74 | 11.11 | 55.60 | 53.33 | 62.17 | +0.515 |
| Ryan | 821:34 | 6 | 24 | 1.75 | 8.70 | 51.21 | 48.05 | 43.57 | +0.428 |
| Jankowski | 762:39 | 10 | 25 | 1.97 | 13.33 | 46.18 | 48.53 | 41.32 | +0.441 |
| Frolik | 595:34 | 13 | 23 | 2.32 | 13.98 | 53.16 | 60.71 | 51.74 | +0.735 |
| Hathaway | 579:03 | 7 | 10 | 1.04 | 13.21 | 41.88 | 47.73 | 46.39 | +0.218 |
| Czarnik | 367:55 | 6 | 11 | 1.79 | 13.33 | 55.60 | 43.75 | 56.15 | +0.420 |
| Mangiapane | 242:27 | 3 | 5 | 1.24 | 9.68 | 54.36 | 52.94 | 60.00 | +0.338 |
| Dube | 227:58 | 1 | 5 | 1.32 | 4.55 | 48.10 | 56.25 | 64.04 | +0.227 |
| Quine | 85:03 | 3 | 4 | 2.82 | 50.00 | 48.91 | 57.14 | 52.00 | +0.327 |
| Lomberg | 27:55 | 0 | 0 | 0 | 0 | 27.27 | n/a | 55.56 | -0.244 |
| Rychel | 18:21 | 0 | 0 | 0 | 0 | 36.36 | 50.00 | 40.00 | -0.268 |
| Peluso | 16:27 | 0 | 0 | 0 | 0 | 48.15 | 0.00 | 25.00 | -0.019 |
These past seven games have been defined by depth scoring more than anything else. Johnny Gaudreau, Elias Lindholm, Sean Monahan, and Matthew Tkachuk have all floundered in various degrees as of late: their points per 60 have fallen dramatically, as have their shooting percentages (Gaudreau and Monahan’s are now closer to their career averages, while Lindholm and Tkachuk are still dramatically above – possibly explained by Lindholm playing with the best linemates he ever has, and Tkachuk only being in his third season). Their underlyings have stayed mostly intact, though; it’s their scoring slump that’s defined them most recently.
The biggest beneficiaries in this segment appear to be Mikael Backlund, Michael Frolik, Austin Czarnik, and Andrew Mangiapane. Backlund, Czarnik, and Mangiapane all saw major increases in their points per 60 – though be wary of Czarnik and Mangiapane’s, as their shooting percentages jumped up by quite a fair bit, as well. Frolik didn’t have as dramatic an improvement, but his goals for ratio shot up, as did Czarnik and Mangiapane’s.
Meanwhile, modest improvements go to Mark Jankowski, Derek Ryan, and Garnet Hathaway.
James Neal was injured for all but 8:20 of this stretch. Bennett and Ryan will look to pass him in season-long ice time next game.
The Flames’ most common line combinations at 5v5 have been:
| Gaudreau | Monahan | Lindholm |
| Tkachuk | Backlund | Frolik |
| Tkachuk | Backlund | Bennett |
The Bennett – Jankowski – Neal line was creeping up towards the Tkachuk – Backlund – Bennett line in terms of ice time, but Neal’s injury, combined with the willingness to continue swapping Frolik and Bennett on Backlund’s line, means it hasn’t happened yet.
Now, the defence (all situations, ordered by ice time):
| Player | TOI | Goals | Points | P/60 | SH% | CF% | GF% | OZS% | Game score |
| Giordano | 1506:28 | 13 | 59 | 2.35 | 7.78 | 56.21 | 61.86 | 47.63 | +1.136 |
| Brodie | 1350:24 | 8 | 31 | 1.38 | 10.13 | 53.07 | 55.24 | 45.70 | +0.678 |
| Hanifin | 1319:52 | 5 | 28 | 1.27 | 5.26 | 50.98 | 51.91 | 49.76 | +0.493 |
| Hamonic | 1095:03 | 5 | 14 | 0.77 | 5.21 | 48.02 | 48.00 | 39.05 | +0.552 |
| Andersson | 924:54 | 2 | 13 | 0.84 | 2.63 | 49.94 | 60.76 | 59.04 | +0.265 |
| Kylington | 422:18 | 3 | 7 | 0.99 | 17.65 | 48.91 | 57.14 | 63.33 | +0.169 |
| Valimaki | 331:58 | 1 | 2 | 0.36 | 4.35 | 47.80 | 34.62 | 64.71 | +0.172 |
| Stone | 176:18 | 0 | 4 | 1.36 | 0 | 48.09 | 35.00 | 50.88 | +0.364 |
| Prout | 173:07 | 0 | 1 | 0.35 | 0 | 49.17 | 50.00 | 54.00 | +0.161 |
Unlike the forward group, the defence didn’t experience any major drops. Mark Giordano is still obviously the best defenceman on the team, his scoring just fell slightly, while TJ Brodie has kept pace. Noah Hanifin’s scoring has dropped as well, while Travis Hamonic’s actually went up – particularly in terms of his shooting percentage.
Rasmus Andersson experienced the most growth over these past seven games, which fits in with Bill Peters’ call for him to play more frequently on the top pairing. He saw increases across the board: scoring, shooting percentage, corsi for, and goals for. In contrast, Oliver Kylington – who has missed a couple of games with injury – has stayed at about the same level.
Dalton Prout, meanwhile, looks set to pass Michael Stone in ice time the next time he dresses for a game. He scored his first point as a Flame, which saw improvements for him statistically. Oscar Fantenberg has yet to dress for the Flames.
And finally, goalies (all situations):
| Player | TOI | SV% | ldSV% | mdSV% | hdSV% | Game score |
| Rittich | 1910:46 | 0.912 | 0.942 | 0.918 | 0.845 | +0.687 |
| Smith | 1870:10 | 0.897 | 0.953 | 0.897 | 0.807 | +0.336 |
Mike Smith started six of seven games during this stretch. David Rittich’s overall lack of game play saw his stats not really change much at all.
Smith, though, has seen notable increases. While his medium-danger save percentage dropped, his high-danger save percentage shot up, from 0.780% to 0.807%. His overall save percentage went up, as well – though he still has more work to do to get his season save percentage back above 0.900%.
He took significant steps forward over these past seven games, though, and while Rittich clearly still has the superior numbers – low-danger save percentages aside – Smith’s have started returning to respectable.
Recent articles from Ari Yanover