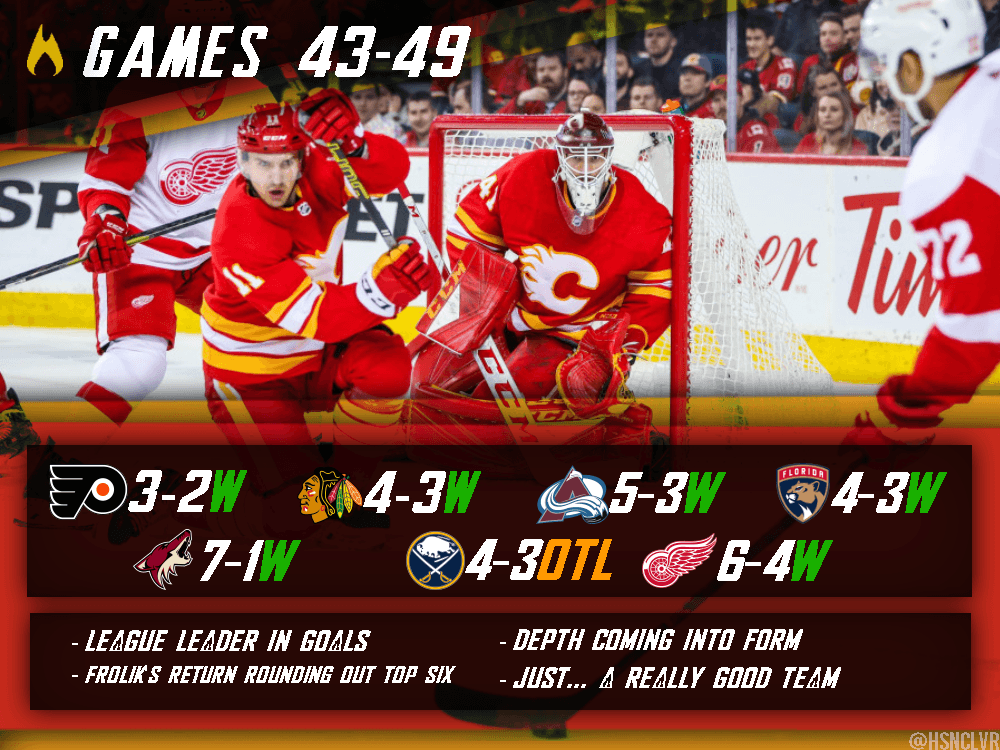
Flames in seven games: 6-0-1 in season’s seventh segment

By Ari Yanover
5 years agoThe Flames only got 13 of a possible 14 points in their seventh seven-game segment of the season, so I guess you could say it could’ve gone better.
In their first seven-game segment, they were 4-3-0. In their second, they improved to 4-2-1. In their third, they were once again 4-3-0. In their fourth, they improved to 5-1-1. In their fifth, they kept it up with a 5-2-0. In the sixth, they fell to 3-2-2. Seems they responded to that weak stretch rather well.
Underlying numbers via Natural Stat Trick.
Team stats
Now at 31-13-5, the Flames haven’t shown any signs of dropping off from the NHL’s best. They have a 0.684 points percentage through the season so far, up from their previous 0.643. It has them second in the NHL, and first in the Western Conference and Pacific Division.
- Their goals for per game is 3.71, up from their earlier 3.57. They’re second overall in the NHL, and first among all Western Conference teams and the Pacific Division.
- Their goals against per game is 2.84, up slightly from their previous 2.83. They’re eighth in the NHL, fifth among Western Conference teams, and second in the Pacific Divison.
- Their goal differential is +41, up from +29. It has them second in the NHL, and first among Western Conference teams and the Pacific Division.
- Their powerplay is at 23.9%, up from their earlier 21.2%. It’s eighth in the NHL. They’re fourth in the Western Conference, and second in the Pacific Division.
- Their penalty kill is at 78.6%, up slightly from their earlier 78.5%. It’s tied for 21st in the NHL. They’re tied for 10th in the Western Conference, and fifth in the Pacific Division.
- At 9:01 penalty minutes per game, they’ve taken fewer infractions, down from 9:19 earlier. They’re 19th when it comes to penalties taken in the NHL, 10th in the Western Conference, and sixth in the Pacific Division.
- Their 5v5 CF/60 is 58.51, down a little from their previous 58.64. It’s the eighth highest in the NHL, fourth among Western Conference teams, and third in the Pacific Divison.
- Their 5v5 CA/60 is 52.29, up a little from their previous 51.91. It’s the second lowest in the NHL, and among Western Conference and Pacific Division teams.
- Their 5v5 CF is 52.81%, down a little from their previous 53.02%. It’s the fifth highest in the NHL, and third among Western Conference Pacific Division teams.
- Their 5v5 shooting percentage is 8.66%, up from 8.24%. It’s ninth in the NHL.
- Their 5v5 save percentage is 91.79%, up from 91.52%. It’s 16th in the NHL.
- Their PDO is 100.04, up from 99.76. It’s tied for 12th in the NHL.
So, what’s changed?
Not a ton, really. The Flames have been more fortunate over this stretch, scoring more, with a higher shooting percentage to match. But with it has come a higher save percentage and PDO, although nothing to indicate this is a fluke for the Flames: everything is still within pretty sustainable levels (although it wouldn’t be surprising to see their goals drop a little in the future).
What might be most eyebrow-raising is just where the team ranks among several key league stats. It isn’t just that they’re numerically the second best team in the NHL right now: they score the goals to match it. They still do a great job of preventing corsi events against them, even if the puck keeps going in (albeit at roughly the same rate as before).
This has ended up being the team we possibly could have predicted from the offseason after they chose to focus on forward depth: one that’s one of the top scorers in the NHL, and with the young defensive group they have in place and with a relatively young starting netminder as well, one that may not be elite at keeping the puck out of their net, but definitely capable – especially when you consider that more often than not, they really can score their way out of trouble.
Player stats
First, the forwards (all situations, ordered by ice time).
Game scores courtesy of our very own Ryan Pike: 0.950 and above is considered great; 0.450-0.950 good; 0.150-0.450 fine; -0.150-0.150 bad; under -0.150 awful.
| Player | TOI | Goals | Points | P/60 | SH% | CF% | GF% | OZS% | Game score |
| Lindholm | 1005:37 | 21 | 56 | 3.34 | 18.10 | 57.09 | 63.33 | 52.63 | +1.253 |
| Gaudreau | 996:24 | 28 | 72 | 4.34 | 17.61 | 60.79 | 69.12 | 67.80 | +1.601 |
| Monahan | 965:46 | 26 | 59 | 3.67 | 17.33 | 60.42 | 66.18 | 69.68 | +1.363 |
| Tkachuk | 863:51 | 24 | 56 | 3.89 | 19.51 | 61.65 | 69.44 | 66.01 | +1.258 |
| Backlund | 819:45 | 10 | 25 | 1.83 | 9.26 | 53.59 | 58.54 | 48.86 | +0.797 |
| Neal | 712:10 | 5 | 12 | 1.01 | 4.90 | 54.95 | 46.15 | 63.74 | +0.376 |
| Bennett | 641:13 | 9 | 19 | 1.78 | 11.69 | 55.56 | 55.36 | 61.74 | +0.551 |
| Ryan | 632:30 | 4 | 16 | 1.52 | 8.89 | 50.33 | 46.43 | 44.02 | +0.344 |
| Jankowski | 569:52 | 7 | 19 | 2.00 | 10.94 | 45.62 | 48.00 | 44.98 | +0.409 |
| Hathaway | 432:10 | 5 | 6 | 0.83 | 15.15 | 39.38 | 41.38 | 47.30 | +0.120 |
| Frolik | 398:40 | 11 | 17 | 2.56 | 18.33 | 52.39 | 60.53 | 50.36 | +0.746 |
| Czarnik | 304:54 | 2 | 6 | 1.18 | 5.56 | 53.69 | 36.00 | 55.36 | +0.293 |
| Dube | 227:58 | 1 | 5 | 1.32 | 4.55 | 48.10 | 56.25 | 64.04 | +0.227 |
| Mangiapane | 115:49 | 0 | 1 | 0.52 | 0 | 48.94 | 14.29 | 56.52 | +0.072 |
| Quine | 85:03 | 3 | 4 | 2.82 | 50.00 | 48.91 | 57.14 | 52.00 | +0.327 |
| Lomberg | 27:55 | 0 | 0 | 0 | 0 | 27.27 | n/a | 55.56 | -0.244 |
| Rychel | 18:21 | 0 | 0 | 0 | 0 | 36.36 | 50.00 | 40.00 | -0.268 |
| Peluso | 16:27 | 0 | 0 | 0 | 0 | 48.15 | 0.00 | 25.00 | -0.019 |
Johnny Gaudreau continues to separate himself from the Flames’ other top forwards. Sean Monahan is leading the pack to try to catch up with him – vain though it probably is – while Matthew Tkachuk and Elias Lindholm are about neck-in-neck. The Flames’ best have remained consistent all season long.
On the pleasant surprise front, though, is that Mikael Backlund no longer looks quite as lonely in the fifth spot as he did before. Michael Frolik’s been strong since returning to the lineup, and that’s been reflected in his performance, as he’s caught up to Backlund in a number of categories. As things stand right now, he’s easily the team’s sixth best forward. Sam Bennett is making a push as seventh, though, as his game has continued to pick up.
The depth looks like it’s starting to come back into form. Mark Jankowski’s prowess on the penalty kill has been helping him, while both James Neal and Derek Ryan experienced upticks. Note that, while Neal’s shooting percentage is still probably the biggest thing making him an outlier compared to the rest of the forwards getting ice time, his points per 60 finally jumped over 1.00. Not to say this is the start of an offensive resurgence for him, because there’s no way to actually tell if that’s going to happen, but wouldn’t it be quite the forward group if it did?
Austin Czarnik’s numbers tend to drop with the more ice time he gets, but once you get past all of the non-Garnet Hathaway regulars, there aren’t a lot of standouts. With about a month to go until the trade deadline, it sure looks like there’s an opening to welcome another forward into the fold.
The Flames’ most common line combinations at 5v5 have been:
| Gaudreau | Monahan | Lindholm |
| Tkachuk | Backlund | Frolik |
| Tkachuk | Backlund | Bennett |
Frolik has overtaken Bennett on the second line, which isn’t much of a surprise: he’s been a perfect fit there since returning to the lineup, and seems to have solidified his spot (at least with the current personnel on hand).
Now, the defence (all situations, ordered by ice time):
| Player | TOI | Goals | Points | P/60 | SH% | CF% | GF% | OZS% | Game score |
| Giordano | 1163:40 | 10 | 49 | 2.53 | 7.87 | 55.99 | 64.71 | 48.54 | +1.192 |
| Brodie | 1068:16 | 6 | 23 | 1.29 | 9.23 | 52.36 | 58.72 | 46.37 | +0.664 |
| Hanifin | 1026:31 | 4 | 24 | 1.40 | 5.26 | 51.88 | 50.93 | 50.47 | +0.517 |
| Hamonic | 820:30 | 3 | 12 | 0.88 | 4.00 | 48.79 | 49.02 | 39.06 | +0.589 |
| Andersson | 690:58 | 1 | 6 | 0.52 | 1.85 | 47.87 | 56.60 | 60.85 | +0.172 |
| Valimaki | 331:58 | 1 | 2 | 0.36 | 4.35 | 47.80 | 34.62 | 64.71 | +0.172 |
| Kylington | 286:52 | 1 | 3 | 0.63 | 9.09 | 49.71 | 50.00 | 64.63 | +0.122 |
| Stone | 176:18 | 0 | 4 | 1.36 | 0 | 48.09 | 35.00 | 50.88 | +0.364 |
| Prout | 100:07 | 0 | 0 | 0 | 0 | 53.37 | 50.00 | 62.96 | +0.183 |
Mark Giordano and TJ Brodie had a great seven games in particular, with Giordano’s stock continuing to climb even higher, and Brodie separating himself from Travis Hamonic and Noah Hanifin. Hamonic and Hanifin are still doing well overall, but they had a rougher go of things these past seven games – something that could be witnessed over the course of the segment, with some uncharacteristic play from them resulting in goals against. Hamonic continues to get the toughest circumstances, by far, of all the defencemen in all situations, but he’s still holding on rather well, even if he’s the lowest points producer of the top four.
Rasmus Andersson and Oliver Kylington, meanwhile, have seen improvement over these past seven games: Kylington in particular as he’s continuing to adapt to the rigours of the NHL (and in playing far more games than likely would have been expected from him this season). The improvement is a continuously welcome sign: there’s a lot of trust being put into these rookies, but game after game they’re starting to show why they’ve earned it.
And finally, goalies (all situations):
| Player | TOI | SV% | ldSV% | mdSV% | hdSV% | Game score |
| Rittich | 1533:00 | 0.917 | 0.937 | 0.933 | 0.853 | +0.804 |
| Smith | 1401:04 | 0.888 | 0.951 | 0.902 | 0.777 | +0.150 |
It was official, but now it’s official-official: David Rittich is the team’s starting goaltender, not just by virtue of superior stats, but by most minutes played. He started five of the team’s seven games during this stretch, and while he didn’t always have the best outings, he gave his team a chance to win pretty much every night (though that Sabres game was iffy).
While it’s perhaps relevant Mike Smith’s low danger save percentage has overtaken Rittich’s, that’s about it. Rittich is still putting up the overall superior numbers – though Smith’s overall improvement, while perhaps not definitive, is at least encouraging.
Recent articles from Ari Yanover