Flames in seven games: 4-2-1 in tenth segment

By Ryan Pike
4 years agoThe Calgary Flames have completed 70 games of the 2019-20 regular season calendar. They’re 85.4% of the way through their season, and so we continue examining their performances in bite-sized seven game morsels.
- In the first segment of this season, they went 3-3-1.
- In their second segment, they went 3-3-1.
- In their third segment, they went 4-2-1.
- In their fourth segment, they went 2-4-1.
- In their fifth segment, they went 6-1-0.
- In their sixth segment, they went 2-4-1.
- In their seventh segment, they went 6-1-0.
- In their eighth segment, they went 2-4-1.
- In their ninth segment, they went 4-3-0.
In their tenth segment, they went 4-2-1.
Underlying numbers via Natural Stat Trick.
Game by game
(Percentage stats in this table are 5v5
| Date | Opponent | Result | CF% | SC% | HDSC% | PP | PK |
| Feb. 25 | Bruins (@) | 5-2 W | 44.6 | 40.0 | 42.9 | 1-for-3 | 1-for-1 |
| Feb. 27 | Predators (@) | 4-3 OTL | 52.2 | 64.0 | 65.4 | n/a | 2-for-2 |
| Feb. 29 | Lightning (@) | 4-3 L | 46.2 | 37.1 | 0.0 | 1-for-2 | 2-for-4 |
| Mar. 1 | Panthers (@) | 3-0 W | 53.3 | 55.8 | 63.2 | 1-for-1 | 3-for-3 |
| Mar. 4 | Blue Jackets (vs) | 3-2 OTW | 58.4 | 45.5 | 60.0 | 0-for-1 | 1-for-1 |
| Mar. 6 | Coyotes (vs) | 3-2 W | 48.5 | 46.8 | 42.9 | 1-for-4 | 3-for-3 |
| Mar. 8 | Golden Knights (vs) | 5-3 L | 33.3 | 35.2 | 38.9 | 1-for-1 | 0-for-1 |
The Flames played three games at home (2-1-0) and four on the road (2-1-1). The Flames had three wins and two losses in regulation, while winning once and losing once in overtime.
The Flames out-chanced their opponents twice times and generated more high danger chances three times. They scored five power play goals and allowed three against.
With 79 points through 70 games, the Flames are chugging along at slightly below a surefire playoff pace. Four wins per segment translates to roughly 80 points though 70 games (and 94 points over a full season). The Flames are basically right where they need to be, give or take a point.
Team stats
The Flames have a 36-27-7 record through their first 70 games. They’ve been better recently than in previous segments, but they’re still not a blow-away good team.
- Their goals for per game is 2.91, up from 2.87. They’re 20th overall in the NHL and 10th in the Western Conference.
- Their goals against per game is 3.06, down from 3.10. They’re 16th in the NHL, and 8th in the Western Conference.
- Their goal differential is -5, up from -9. They’re 21st in the NHL, and 11th in the Western Conference.
- Their power play is at 21.2%, up from 19.9%. They’re 11th in the NHL, and 6th in the Western Conference.
- Their penalty kill is at 82.1%, up from 81.5%. They’re 9th in the NHL and 5th in the Western Conference.
- They’ve taken 8.6 minutes of penalties per game, down from 9.1. That’s 11th-most in the NHL, and 5th-most in the Western Conference.
- Their 5v5 CF/60 is 57.98, down from 58.51. It’s the 9th highest in the NHL, and 4th highest among Western Conference teams.
- Their 5v5 CA/60 is 57.40, up from 57.30. It’s the 23rd lowest in the NHL, and 11th lowest among Western Conference teams.
- Their 5v5 CF is 50.3%, down from 50.5%. It’s the 15th highest in the NHL, and 6th among Western Conference teams.
- Their 5v5 shooting percentage is 7.64%, up from 7.52%. It’s 23rd in the NHL.
- Their 5v5 save percentage is 91.89%, up from 91.66%. It’s 14th in the NHL.
- Their PDO is 0.995, up from 0.992. It’s 22nd in the NHL.
The Flames are in the top third of the NHL in shot attempt generation and penalty killing. They’re in the middle third of the NHL in goaltending, penalties taken and the power play. They’re bottom third in the league at shot attempt suppression and shooting.
They’re a mixed bag, in other words.
Player stats
First, the forwards (all situations, ordered by ice time).
Game scores: 0.950 and above is considered great; 0.450-0.950 good; 0.150-0.450 fine; -0.150-0.150 bad; under -0.150 awful.
| Player | TOI | Goals | Points | P/60 | SH% | CF% | GF% | OZFO% | Game score |
| Lindholm | 1380:30 | 29 | 54 | 2.35 | 17.2 | 51.7 | 50.0 | 53.1 | 0.759 |
| Gaudreau | 1315:18 | 18 | 58 | 2.65 | 8.6 | 56.9 | 56.7 | 68.2 | 0.818 |
| Monahan | 1267:07 | 22 | 48 | 2.27 | 13.3 | 55.9 | 54.4 | 68.1 | 0.636 |
| Tkachuk | 1263:15 | 23 | 61 | 2.90 | 12.2 | 58.5 | 57.6 | 60.9 | 0.935 |
| Backlund | 1256:10 | 16 | 45 | 2.15 | 10.2 | 50.3 | 51.1 | 50.4 | 0.607 |
| Ryan | 989:13 | 10 | 29 | 1.76 | 9.7 | 46.9 | 52.7 | 42.4 | 0.430 |
| Mangiapane | 931:40 | 17 | 32 | 2.06 | 15.6 | 54.0 | 54.6 | 47.6 | 0.606 |
| Lucic | 906:37 | 8 | 20 | 1.32 | 9.6 | 54.5 | 53.7 | 53.6 | 0.298 |
| Bennett | 650:34 | 8 | 12 | 1.11 | 9.7 | 52.0 | 50.0 | 51.5 | 0.263 |
| Jankowski | 621:28 | 5 | 7 | 0.68 | 13.2 | 41.5 | 24.4 | 30.6 | 0.099 |
| Rieder | 609:66 | 4 | 10 | 0.98 | 5.2 | 43.1 | 27.3 | 41.6 | 0.212 |
| Dube | 570:37 | 6 | 16 | 1.68 | 10.0 | 47.0 | 54.0 | 49.7 | 0.315 |
| Frolik | 453:16 | 5 | 10 | 1.32 | 11.4 | 48.3 | 31.4 | 46.8 | 0.247 |
| Rinaldo | 157:07 | 3 | 5 | 1.91 | 15.8 | 43.3 | 46.2 | 47.0 | 0.120 |
| Quine | 88:15 | 1 | 1 | 0.68 | 8.3 | 51.6 | 33.3 | 49.1 | 0.179 |
| Czarnik | 81:30 | 2 | 3 | 2.21 | 22.2 | 54.6 | 75.0 | 58.9 | 0.394 |
| Robinson | 61:10 | 1 | 1 | 0.98 | 16.7 | 47.2 | 50.0 | 46.2 | 0.250 |
The only significant usage change was Andrew Mangiapane passing Milan Lucic in ice time. Otherwise, Geoff Ward continues with his status quo player usage.
Alright, with a dozen games left here’s how the forwards are:
- Matthew Tkachuk is their best forward.
- After him, there’s Johnny Gaudreau and Elias Lindholm on a level.
- Below them, there’s Sean Monahan, Andrew Mangiapane and Mikael Backlund.
And below them are a clump of depth players, led by Derek Ryan and Dillon Dube.
Backlund and Mangiapane did a great job separating themselves from that depth pack performance-wise over the past seven games. The Flames have a well-defined top six, which is good, but a fairly mediocre rest of the forward group, which is decidedly ungood. Nobody’s forcing their way into that top six group from a performance standpoint.
The Flames’ most common line combinations at 5v5 are:
| Gaudreau | Monahan | Lindholm |
| Mangiapane | Backlund | Tkachuk |
| Lucic | Ryan | Dube |
Now, the defence (all situations, ordered by ice time):
| Player | TOI | Goals | Points | P/60 | SH% | CF% | GF% | OZFO% | Game score |
| Hanifin | 1482:00 | 5 | 22 | 0.89 | 3.8 | 50.2 | 46.2 | 48.4 | 0.401 |
| Giordano | 1432:55 | 5 | 31 | 1.30 | 3.2 | 51.0 | 52.0 | 49.0 | 0.730 |
| Andersson | 1395:30 | 5 | 22 | 0.95 | 4.0 | 53.0 | 50.4 | 58.9 | 0.440 |
| Brodie | 1309:19 | 4 | 19 | 0.87 | 6.2 | 50.1 | 48.4 | 45.0 | 0.399 |
| Hamonic | 1059:43 | 3 | 12 | 0.68 | 3.6 | 43.4 | 39.3 | 34.2 | 0.348 |
| Kylington | 657:55 | 2 | 7 | 0.64 | 5.4 | 48.0 | 43.8 | 60.0 | 0.123 |
| Stone | 538:40 | 2 | 7 | 0.78 | 3.5 | 42.2 | 41.3 | 46.0 | 0.155 |
| Gustafsson | 126:04 | 0 | 3 | 1.43 | 0.0 | 47.5 | 58.3 | 66.2 | 0.008 |
| Forbort | 124:09 | 0 | 0 | 0.00 | 0.0 | 37.2 | 33.3 | 39.7 | -0.046 |
| Davidson | 85:52 | 0 | 0 | 0.00 | 0.0 | 46.7 | 40.0 | 60.4 | 0.154 |
| Yelesin | 49:58 | 0 | 0 | 0.00 | 0.0 | 54.1 | 50.0 | 60.9 | 0.125 |
The injuries have muddled the usage a bit, but here’s what we know: Mark Giordano is the team’s top defender, followed (in order) by Rasmus Andersson, Noah Hanifin, TJ Brodie and Travis Hamonic.
Welcome to the Flames, Erik Gustafsson and Derek Forbort. Neither has really moved the needle to a considerable amount thus far, and the team is still extremely reliant on their top two pairings – and especially 36-year-old Giordano.
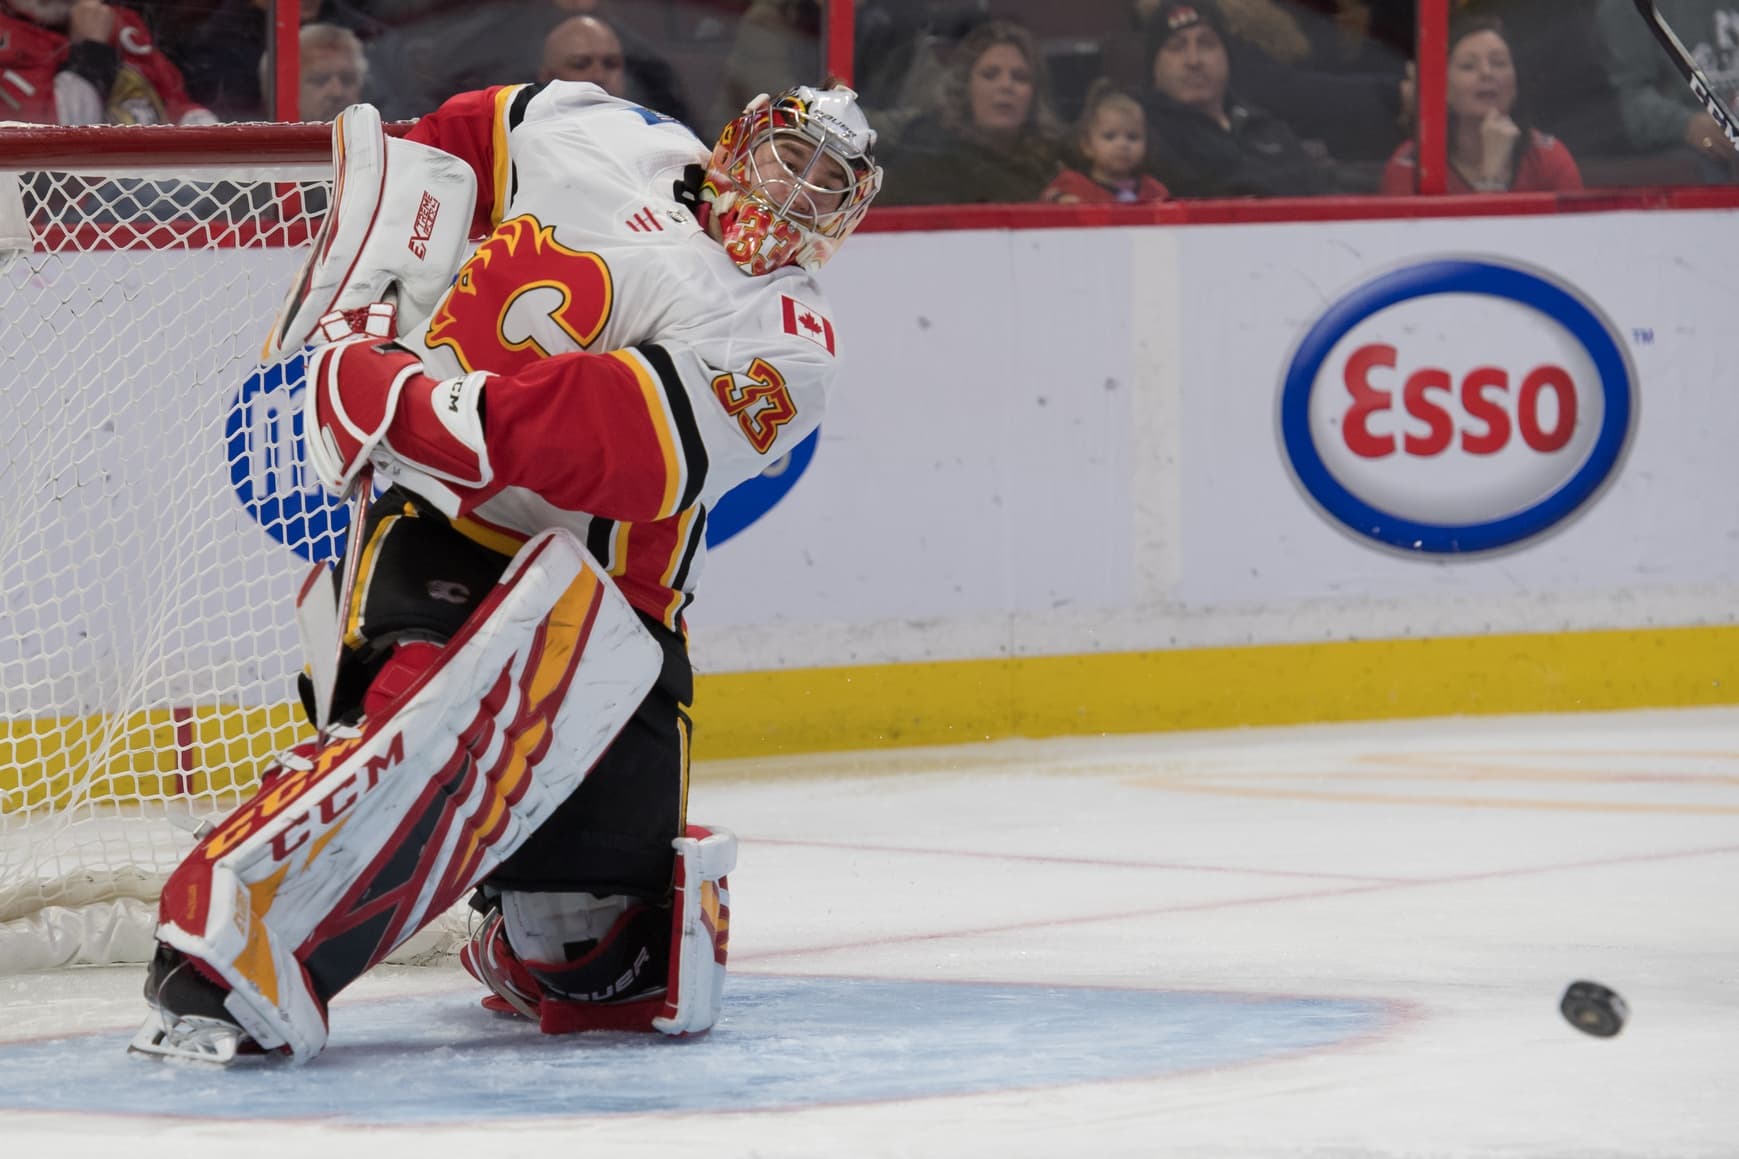
And finally, goalies (all situations):
| Player | TOI | SV% | ldSV% | mdSV% | hdSV% | Game score |
| Rittich | 2791:58 | .907 | .961 | .877 | .837 | 0.636 |
| Talbot | 1414:39 | .919 | .973 | .916 | .799 | 0.933 |
He’s played just over half as many games, but Cam Talbot is the better goaltender than David Rittich under low and medium danger conditions. And the difference between them at high danger really isn’t that stark.
Recent articles from Ryan Pike