
Nation Sites
The Nation Network
FlamesNation has no direct affiliation to the Calgary Flames, Calgary Sports and Entertainment, NHL, or NHLPA
What could J.T. Miller do for the Calgary Flames?

Photo credit: Sergei Belski-USA TODAY Sports

Feb 9, 2022, 10:00 ESTUpdated: Feb 8, 2022, 22:07 EST
The current roster is well on their way towards earning a playoff berth in the 2021-22 season, meaning the club is putting themselves in a position to add a possible impact player at this year’s trade deadline. The primary focus of Flashpoint trade targets will be players that could potentially fill a role as a second line center. I am not advocating whether or not they should do this, I am simply examining how player X named in rumour Y would fit into the Flames current roster construction.
The first player to take a look at, Vancouver’s J.T. Miller.
The rumour
This brings some legitimacy to start the discussion. We have DFO’s fearless insider Frank Seravalli mentioning Calgary as having interest in the Canucks forward.
Offensive impact
While his development pattern could play a part in his total skillset, long term future, and a myriad of other things this move would be primarily about winning and contending now. As such we will look at his impact from 2019-20 up till today, using his modern metrics to see just how well a player of his calibre could fit into the structure of Calgary’s roster. If you’re familiar with my style of writing in any form you’ll know that now is when I spam you with charts – and explanations of what those charts mean in terms of actual on-ice play.
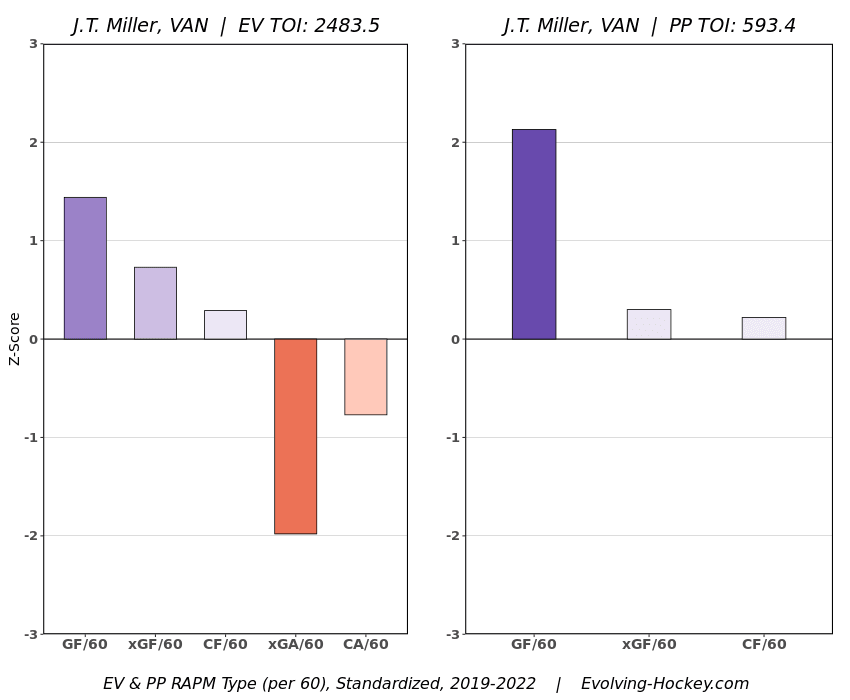
We start with the good old Evolving-Hockey.com twins and their RAPM (regularly adjusted plus minus) chart. We’ll refer to this later when discussing Miller’s defensive impact/tendencies and powerplay potential, but for now we’re just going to focus on the two bars on the left side of this graphic. xGF/60 is a metric that tracks the quality of chances (on a typical night anyways – can be skewed if your team just flings shots from every area of the ice). GF/60 is actual goals scored per 60 minutes. The baseline you see is considered replacement level in the NHL when every single player is entered into the same database. As we can see Miller ranks positively over the last 3 seasons in his ability to help create quality chances (xGF/60) and even more-so turning those chances into actual goals (GF/60). That’s a little something for both eye test and analytics folks to be positive about. Next we go to HockeyViz.com to see just where Miller has been creating the offence from the lsat few season as well as looking at where he is scoring these goals from on the ice.
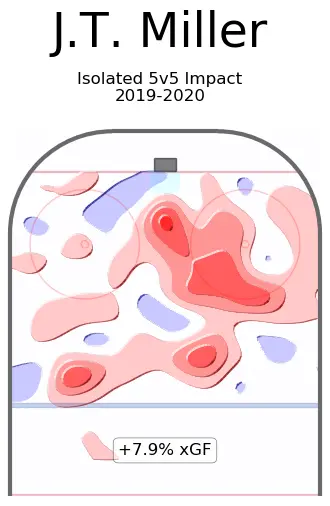
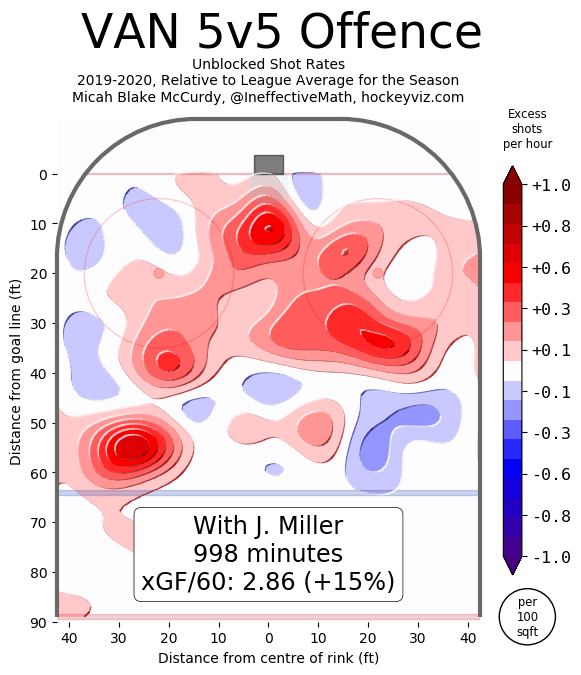
The first two impact charts I bring about show both individual isolated impact (1st) and overall group impact (2nd) on offence created. In his first season with Vancouver Miller was a beast at creating chances to the goaltenders left himself, and as a part of a successful line plenty of chances from the high danger area of the ice. Red on these charts mean above average (or that replacement baseline discussed earlier) shot contributions from that area of the ice, blue means a lack of chances and translates to an area where the player hasn’t been able to create offence. Miller showed up in Vancouver and his impact to creating chances was instantaneous – a player that boosted the profile of Vancouver’s top 6 forwards. Reminder at this point that these two charts are just showing Miller’s participation in creating chances and does not show actual goals – we call that a finishing chart and we’ll share that next.

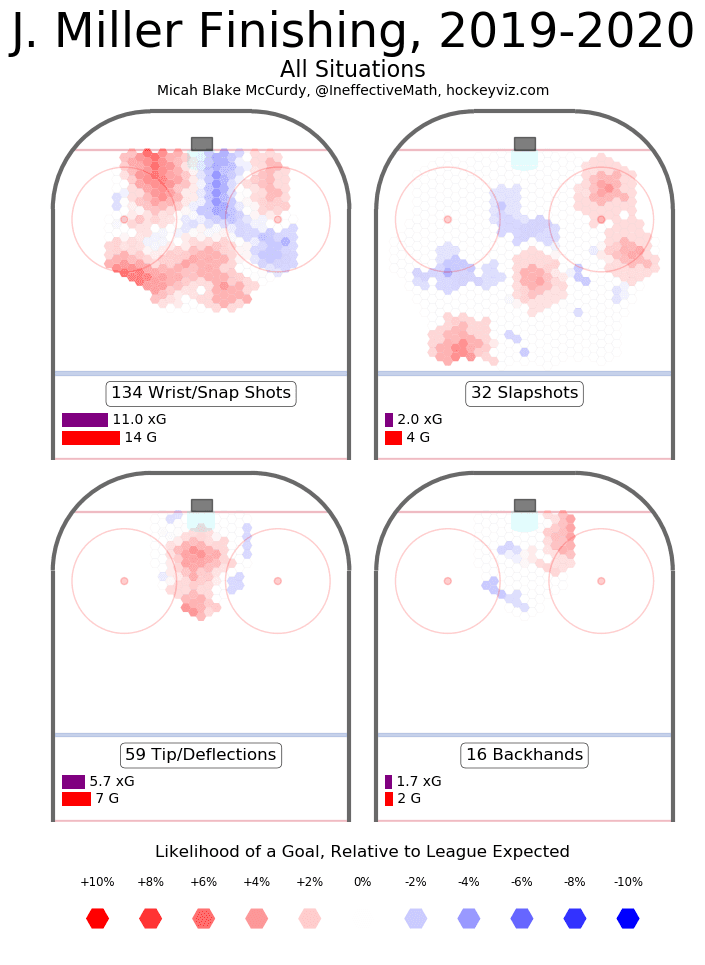
As the far left bar from his RAPM chart stated Miller is an above average finisher. In the last 3 seasons he’s been able to find more goals than his creation of offence suggest he could achieve. Linemates surely help play into such a metric but as we can see from his own individual impact in creating offence this isn’t something that was completely reliant on linemates. The purple bar shows us how many goals he would have been expected to score while the red shows us how many he actually got, and this is all situations so it does include the power play. Just for fun I will show you how he scored those goals too, because we have the technology and its fun to see.
Now all of this is just from 2019-20 so far, as that was the season Miller experienced the most success from an individual standpoint during his time in Vancouver. These high numbers and such have been drug down over the last two seasons as the Canucks themselves started to falter in their structure and level of team defence. Lack of strong defence leads to a lack of possession, which ultimately leads to a lack of chances generated overall. The Calgary Flames today currently play a possession heavy, slot driven offensive attack – all of which would benefit Miller and his game in a profoundly positive sense.
Verdict: J.T. Miller would be able to adapt & improve the roster should he be available, particularly in his ability to get goals.
Defensive Impact
We’ll post the RAPM chart again to save the reader from scrolling back upwards to it, but this time we’re planning on dialing in on the metric to the right of the main chart. xGA/60 is essentially the polar opposite to xGF/60 – are you giving up quality chances or defending them. CF/60 and CA/60 can largely be determined based on team strength and team play so I don’t put too much emphasis into those, but xGA does allow us to see defensive chances against. As we see Miller has been well below replacement level in that regard of late – let’s figure out why.
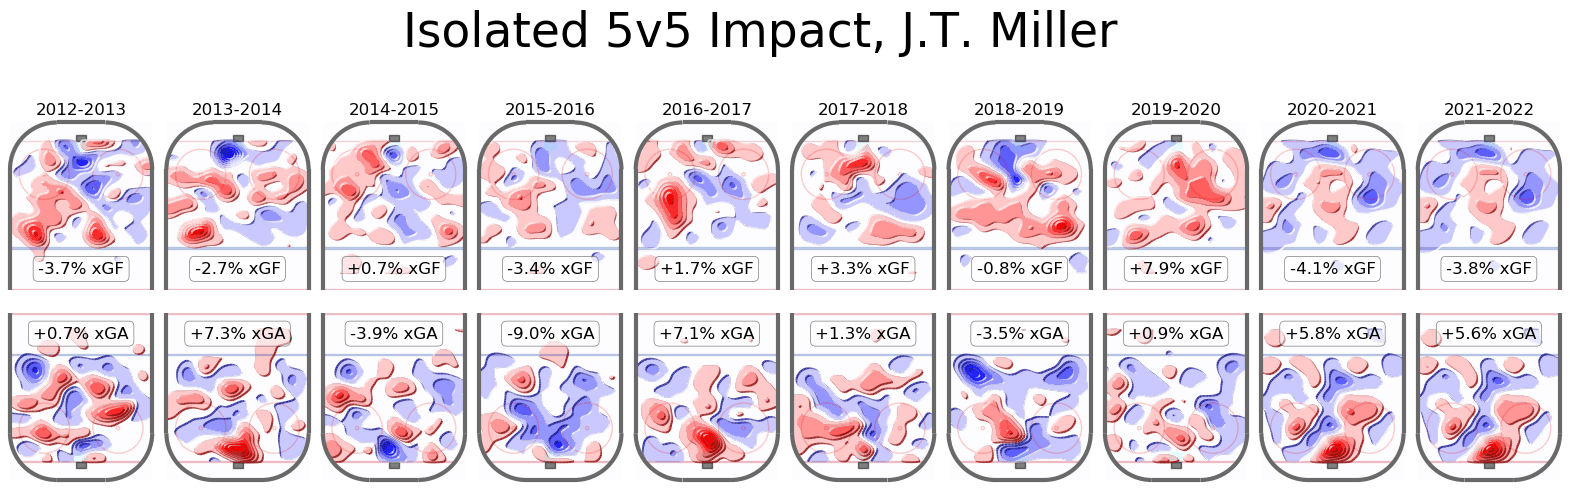
Earlier I posted isolated offensive impact from 2019-20, which was just the top 1/2 of that year from this chart. This one shows each years isolated impact offensively on the top of the rinks while showing isolated defensive impact on the bottom. What this tells me is that after Vancouver’s mini playoff run in the bubble the right side of their defence took a massive hit at limiting shot chances. No idea what could have possibly happened that off-season that could have lead to that *cough* Tanev leaving *cough*. We hardly have enough information to say just what kind of impact Bruce Boudreau is going to have on the Canucks, but based on my viewings of them they’ve really shored up defensively. Long-term if that were continue we would more than likely see Miller return to having an impact similar to that of 2019-20, but based on what is being said Miller might not still be on Vancouver roster to see that come to fruition.
Now while I have faith stronger structure can help the numbers from the previous two seasons can be a bit concerning. For both 2020-21 and 2021-22 the team’s overall defensive metrics improve with Miller off the ice. Now those aren’t isolated numbers like shown above, rather they incorporate the whole team, but it is still a concern nonetheless. As we can see even something as simple as new personnel in different roles can affect another players individual impact (re: Tanev leaving). That is where trust in teammates to defend certain areas of the ice comes into play. Miller is not going out of his way to cover for his teammates should they miss their assignments, he is sticking to his assignments – something that could benefit from playing on a team that has clearly defined jobs for each position.
Verdict: While he’s not going to shake the earth in a positive sense Miller has been able to show in his past that he can contribute to group defence at an acceptable level. As long as his offence/finishing ability holds taking a risk on someone that looks like him defensively – and playing him with a defensive guru like Blake Coleman – could go well for Calgary.
Special Teams
For the third time we bring back the RAPM chart and this time we focus on Millers power play impact (right side of chart). The RAPM charts are a great starting basis for anyone wanting to understand analytics. They won’t tell you why the players impact is what it is, but they at least give you a starting reference of what to look for if doing a deeper analysis. One thing from the power play chart stands out from the crowd and that’s his GF/60. We know Miller has been an above average finisher (the evidence you’ve already seen), but he takes it to a new level on the power play. He’s not the driver/creator of the plays themselves, but he knows how to finish them off. Calgary themselves have already got into some low scoring slug fests this season so having a guy who can improve power play production can be the difference between a W or an L in those games. Miller could – in theory only – take Monahan’s spot on PP1. Such an act would drop Monahan to PP2, but the end effect would mean more offence on both units with the man advantage.
Verdict: J.T. Miller can do the one thing the Flames need most of all – score.
How would he fit?
Miller checks the boxes of everything Calgary needs offensively to improve their lineup, but there are some logistical problems acquiring him would bring about. The Flames are currently projected to have around $5.5 million in cap space at the trade deadline – and via PuckPedia Miller carries a cap hit of $5.25 million. So it would seemingly fit except for the fact Miller has another year under contract which is where things get a little… complicated. Assuming a cap next year of $82.5 million that would give Calgary roughly $32 million in space to get Gaudreau, Tkachuk, Mangiapane, and Kylington signed to contracts. Also needing new deals or replacements would be Zadorov, Gudbranson, Pitlick, Ritchie, Richardson and Lewis. When you consider how much the first four listed could command in salaries that doesn’t leave much to round out the bottom of the roster with depth.
If the Flames brass can get the cap logistics together and they can move forward without losing any significant pieces (13, 19, 56, and 88), Miller provides the exact type of offence the Flames need to get for their top 6. It would be more ideal if he held his stick the other way, but for now we aren’t going to be too picky about that. Based on the impact Darryl Sutter has had on the whole roster I do believe that if the Flames were to acquire Miller via trade he could significantly help their chances of legitimately competing in this season’s Stanley Cup playoffs.
(Statistics and charts have come from Evolving-Hockey.com and HockeyViz.com, as well as Cap resources found at PuckPedia.com – for any questions or concerns reach out to @Flash_33 on twitter)
THIS ARTICLE BROUGHT TO YOU BY DAILYFACEOFF

Looking to up your fantasy hockey game? DailyFaceoff has the tools you need for both daily and season-long fantasy leagues, including a lineup optimizer, daily projections, and a whole lot more. Sign up for the DailyFaceoff tools here.
Breaking News
- Looking at some unique Flames holiday history
- Flames weekly notebook: Rasmus Andersson has been excellent
- Flames Prospect Roundup: How the standings shape up entering the holiday break
- NHL Notebook: Sidney Crosby takes sole possession of most points in Penguins’ franchise history
- FlamesNation Mailbag: Waiting for Santa with reader questions