Flames in seven games: 4-3-0 in season’s 11th segment

By Ari Yanover
5 years ago The Flames won some, and they lost some. But, as they’ve done throughout the season, they won more than they lost.
In their first seven-game segment, they were 4-3-0. In their second, they improved to 4-2-1. In their third, they were once again 4-3-0. In their fourth, they improved to 5-1-1. In their fifth, they kept it up with a 5-2-0. In their sixth, they fell to 3-2-2. In their seventh, they shot up to 6-0-1. In their eighth, they plummeted to 3-3-1. In their ninth, they recovered back to 6-0-1. In their 10th, they fell to 3-4-0 – their worst stretch of the year. Their 11th was decidedly average as they play out the final matches of a regular season without too much left to play for.
Underlying numbers via Natural Stat Trick.
Team stats
Now at 47-23-7, the Flames seem pretty likely to win the division, even if they’ve had a bit of trouble slicing the jugular as of late. They have a .656 points percentage through the season so far, down from their previous .664. It has them third in the NHL, and first in the Western Conference and Pacific Division.
- Their goals for per game is 3.49, down from their earlier 3.57. They’re fourth overall in the NHL, and second among all Western Conference teams and the Pacific Division.
- Their goals against per game is 2.74, down from their previous 2.84. They’re tied for eighth in the NHL, tied for fifth among Western Conference teams, and tied for second in the Pacific Divison.
- Their goal differential is +54, up from their previous +47. It has them second in the NHL, and first among Western Conference teams and the Pacific Division.
- Their powerplay is at 20.2%, down from their earlier 21.8%. It’s 15th in the NHL. They’re eighth in the Western Conference, and second in the Pacific Division.
- Their penalty kill is at 79.3%, down a little from their earlier 79.7%. It’s tied for 21st in the NHL. They’re ninth in the Western Conference, and fifth in the Pacific Division.
- At 8:47 penalty minutes per game, they’ve taken the same number of infractions as before. They’re tied for 20th when it comes to penalties taken in the NHL, tied for ninth in the Western Conference, and tied for fourth in the Pacific Division.
- Their 5v5 CF/60 is 61.03, up from their previous 60.47. It’s the sixth highest in the NHL, and third among Western Conference and Pacific Division teams.
- Their 5v5 CA/60 is 52.17, down from their previous 52.97. It’s the third lowest in the NHL, and second lowest among Western Conference and Pacific Division teams.
- Their 5v5 CF is 53.91%, up from their previous 53.31%. It’s the fifth highest in the NHL, and third among Western Conference and Pacific Division teams.
- Their 5v5 shooting percentage is 8.67%, down a little from 8.76%. It’s sixth in the NHL.
- Their 5v5 save percentage is 91.96%, up from 91.64%. It’s 15th in the NHL.
- Their PDO is 1.006, up a little from their previous 1.004. It’s tied for seventh in the NHL.
So, what’s changed?
The Flames are seeing fewer goals: both for and against. Giving up fewer goals is definitely a positive – and it’s reflected in their increased save percentage, as well – but for a team that’s really built to be able to come at you with four forward lines and a slew of mobile defencemen, scoring fewer goals is definitely a bad sign.
What also isn’t helping matters is that the Flames’ shooting percentage did fall a bit, but still remains one of the higher ones in the NHL: not to as drastic an extent as some of the teams above them (the Capitals are shooting over 10%, while the Lightning and Leafs are both close to it), but enough to make you wonder if the Flames’ luck has run out.
It’s also worth noting the Flames have one of the better PDOs in the NHL, but, like with their shooting percentage, the teams above them in that particular stat are mostly at a number that’s truly calling for regression. There’s also some solace to be taken in the Flames’ corsi stats improving over these seven games: they’ve still created quite a bit of their own luck, in part by being a good team on their own.
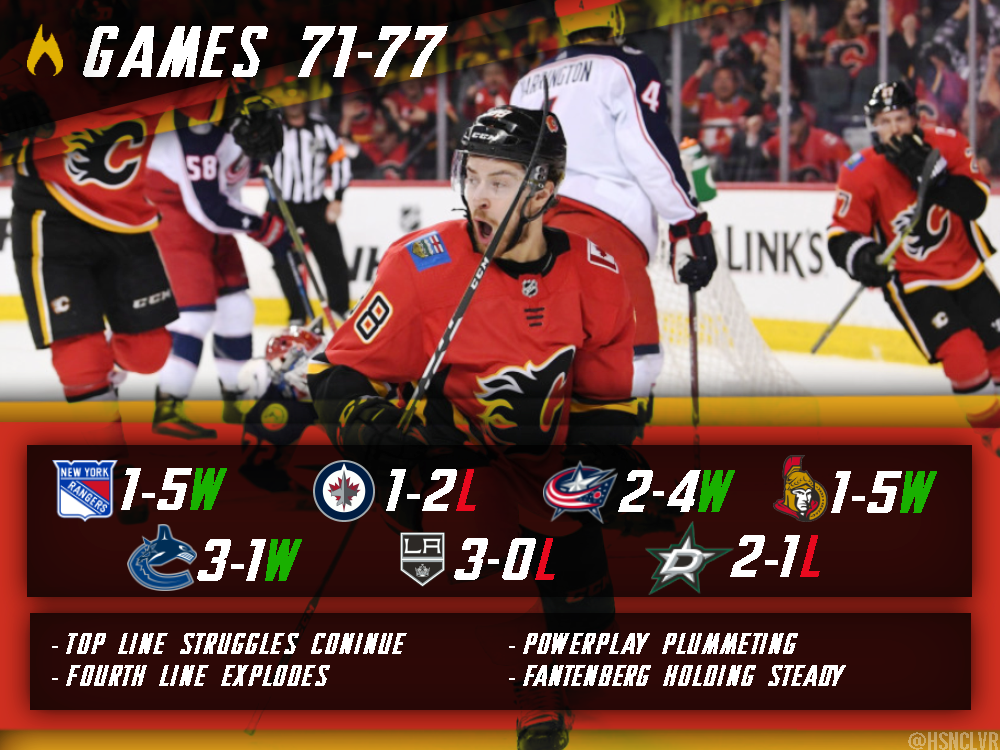
However, the powerplay has been steadily dropping and shows no real signs of recovery. They’re barely in the top half in the NHL now, and that’s a problem – especially for a team so high scoring as this one. Surely it can’t keep plummeting like this, right?
Player stats
First, the forwards (all situations, ordered by ice time).
Game scores courtesy of our very own Ryan Pike: 0.950 and above is considered great; 0.450-0.950 good; 0.150-0.450 fine; -0.150-0.150 bad; under -0.150 awful.
| Player | TOI | Goals | Points | P/60 | SH% | CF% | GF% | OZS% | Game score |
| Lindholm | 1551:34 | 27 | 77 | 2.98 | 15.25 | 56.04 | 61.62 | 53.48 | +1.099 |
| Gaudreau | 1548:24 | 35 | 93 | 3.60 | 14.64 | 60.49 | 64.74 | 68.76 | +1.354 |
| Monahan | 1437:33 | 31 | 76 | 3.17 | 15.27 | 60.00 | 62.30 | 70.15 | +1.138 |
| Tkachuk | 1355:16 | 34 | 76 | 3.36 | 17.17 | 62.41 | 67.09 | 67.28 | +1.161 |
| Backlund | 1305:13 | 20 | 46 | 2.11 | 10.20 | 54.63 | 60.16 | 50.97 | +0.866 |
| Ryan | 1035:09 | 9 | 33 | 1.91 | 9.57 | 52.74 | 54.35 | 45.79 | +0.536 |
| Jankowski | 942:07 | 11 | 27 | 1.72 | 11.70 | 46.65 | 42.86 | 41.96 | +0.404 |
| Bennett | 934:22 | 12 | 26 | 1.67 | 10.62 | 56.18 | 51.16 | 63.85 | +0.500 |
| Neal | 868:16 | 5 | 15 | 1.04 | 3.94 | 55.53 | 50.00 | 65.20 | +0.405 |
| Frolik | 797:21 | 15 | 33 | 2.48 | 12.50 | 54.91 | 61.84 | 53.52 | +0.794 |
| Hathaway | 727:52 | 10 | 16 | 1.32 | 14.08 | 44.08 | 50.94 | 48.80 | +0.277 |
| Czarnik | 542:28 | 6 | 14 | 1.55 | 10.17 | 56.90 | 46.67 | 60.20 | +0.409 |
| Mangiapane | 398:04 | 7 | 11 | 1.66 | 12.50 | 54.74 | 62.96 | 62.07 | +0.446 |
| Dube | 227:58 | 1 | 5 | 1.32 | 4.55 | 48.10 | 56.25 | 64.04 | +0.227 |
| Quine | 97:58 | 3 | 4 | 2.45 | 37.50 | 50.00 | 50.00 | 56.25 | +0.265 |
| Lomberg | 27:55 | 0 | 0 | 0 | 0 | 27.27 | n/a | 55.56 | -0.244 |
| Rychel | 18:21 | 0 | 0 | 0 | 0 | 36.36 | 50.00 | 40.00 | -0.268 |
| Peluso | 16:27 | 0 | 0 | 0 | 0 | 48.15 | 0.00 | 25.00 | -0.019 |
| Lazar | 4:48 | 0 | 0 | n/a | 0 | 55.56 | 0.00 | 75.00 | -0.030 |
The top four forwards – Elias Lindholm, Johnny Gaudreau, Sean Monahan, and Matthew Tkachuk – haven’t faltered in their place among the Flames’ forwards much at all. There was a shift among the four of them, though: while Gaudreau has had a big enough lead established over the rest in terms of his prowess this season, the top line’s continued faltering has had its effect. Combine that with Tkachuk scoring more over this seven-game stretch, and his game score is actually now second among all Flames forwards, overtaking Monahan and Lindholm’s. He’s improved as they’ve dropped.
Mikael Backlund has remained steady, just as he has all year, while Michael Frolik saw a slight boost, in part due to scoring more often.
The main storyline among the forward group over this last stretch of games, though – other than the first line’s struggles – has been the fourth line. They exploded over this recent stretch, with Derek Ryan, Andrew Mangiapane, and Garnet Hathaway seeing sharp upticks in terms of points scored, both in terms of raw totals and points per 60. They – along with Austin Czarnik – were also on the ice for more goals for than against (especially Mangiapane), and the fourth line all saw their game scores jump up, as well.
Mark Jankowski trod along, overtaking Sam Bennett in season-long ice time as the former has dealt with injuries during this stretch. James Neal’s shooting percentage fell below 4%, and while there isn’t much solace to take in that, there is some to find in the fact that his on-ice numbers aren’t bad at all, and his career shooting percentage is 11.6%: yes, this year has not been great, but it’s also entirely possible he’s been comically unlucky and there is reason to hope he has a better second season with the Flames beyond blind optimism.
Alan Quine’s stats fell a bit in the limited time he played, while Curtis Lazar finally got to make his NHL debut this season and did nothing with almost no time.
The Flames’ most common line combinations at 5v5 have been:
| Gaudreau | Monahan | Lindholm |
| Tkachuk | Backlund | Frolik |
| Tkachuk | Backlund | Bennett |
The Mangiapane – Ryan – Hathaway line is creeping up towards the former Tkachuk – Backlund – Bennett line in terms of ice time. The first and second lines have held pretty consistent for most of the season; the fourth line has come together, as well, giving the Flames a predictable – if overall effective – three of four lines.
Now, the defence (all situations, ordered by ice time):
| Player | TOI | Goals | Points | P/60 | SH% | CF% | GF% | OZS% | Game score |
| Giordano | 1826:21 | 16 | 72 | 2.37 | 7.48 | 56.76 | 60.79 | 48.19 | +1.176 |
| Brodie | 1636:57 | 9 | 33 | 1.21 | 9.28 | 53.84 | 54.76 | 47.09 | +0.667 |
| Hanifin | 1603:55 | 5 | 31 | 1.16 | 4.42 | 51.69 | 50.94 | 50.71 | +0.505 |
| Hamonic | 1380:00 | 7 | 17 | 0.74 | 5.69 | 48.63 | 49.68 | 40.47 | +0.587 |
| Andersson | 1168:13 | 2 | 16 | 0.82 | 1.90 | 52.29 | 59.57 | 60.00 | +0.334 |
| Kylington | 440:27 | 3 | 7 | 0.95 | 16.67 | 48.90 | 54.55 | 63.71 | +0.163 |
| Valimaki | 331:58 | 1 | 2 | 0.36 | 4.35 | 47.80 | 34.62 | 64.71 | +0.172 |
| Prout | 186:55 | 0 | 1 | 0.32 | 0 | 48.78 | 50.00 | 52.73 | +0.152 |
| Stone | 182:45 | 0 | 4 | 1.31 | 0 | 47.86 | 35.00 | 50.00 | +0.329 |
| Fantenberg | 177:25 | 0 | 1 | 0.34 | 0 | 56.85 | 70.00 | 58.33 | +0.371 |
If you were counting on points from the blue line, then there was pretty much just one player you were relying on: Mark Giordano. While his offensive stats increased, everyone else’s went down.
The defence has, for the most part, been consistent, though. Giordano, TJ Brodie, and Rasmus Andersson had good segments, while Travis Hamonic and Noah Hanifin mostly treaded water (though they’ve already been playing overall well, themselves).
Oscar Fantenberg has gotten more games in, and as he has, his stats have fallen – though it’s more appropriate to say they’ve been balancing out. He’s still putting up good results overall, suggesting this is a level of play he very well may be able to keep up – and making it increasingly evident why he’s sticking around as a regular in the lineup.
Michael Stone’s numbers dropped over the couple of minutes he played. Oliver Kylington sat out this entire seven-game segment, as did Dalton Prout.
And finally, goalies (all situations):
| Player | TOI | SV% | ldSV% | mdSV% | hdSV% | Game score |
| Rittich | 2385:01 | 0.911 | 0.941 | 0.924 | 0.834 | +0.667 |
| Smith | 2221:52 | 0.899 | 0.957 | 0.897 | 0.810 | +0.369 |
Both goalies got their fair share of starts over this seven-game segment, without either of their numbers changing too much.
The most notable jump was David Rittich’s medium-danger save percentage going up; otherwise, things for the most part held or fluctuated very slightly.
Recent articles from Ari Yanover