
Nation Sites
The Nation Network
FlamesNation has no direct affiliation to the Calgary Flames, Calgary Sports and Entertainment, NHL, or NHLPA
Inside the Boxscore: 2016-17 Calgary Flames
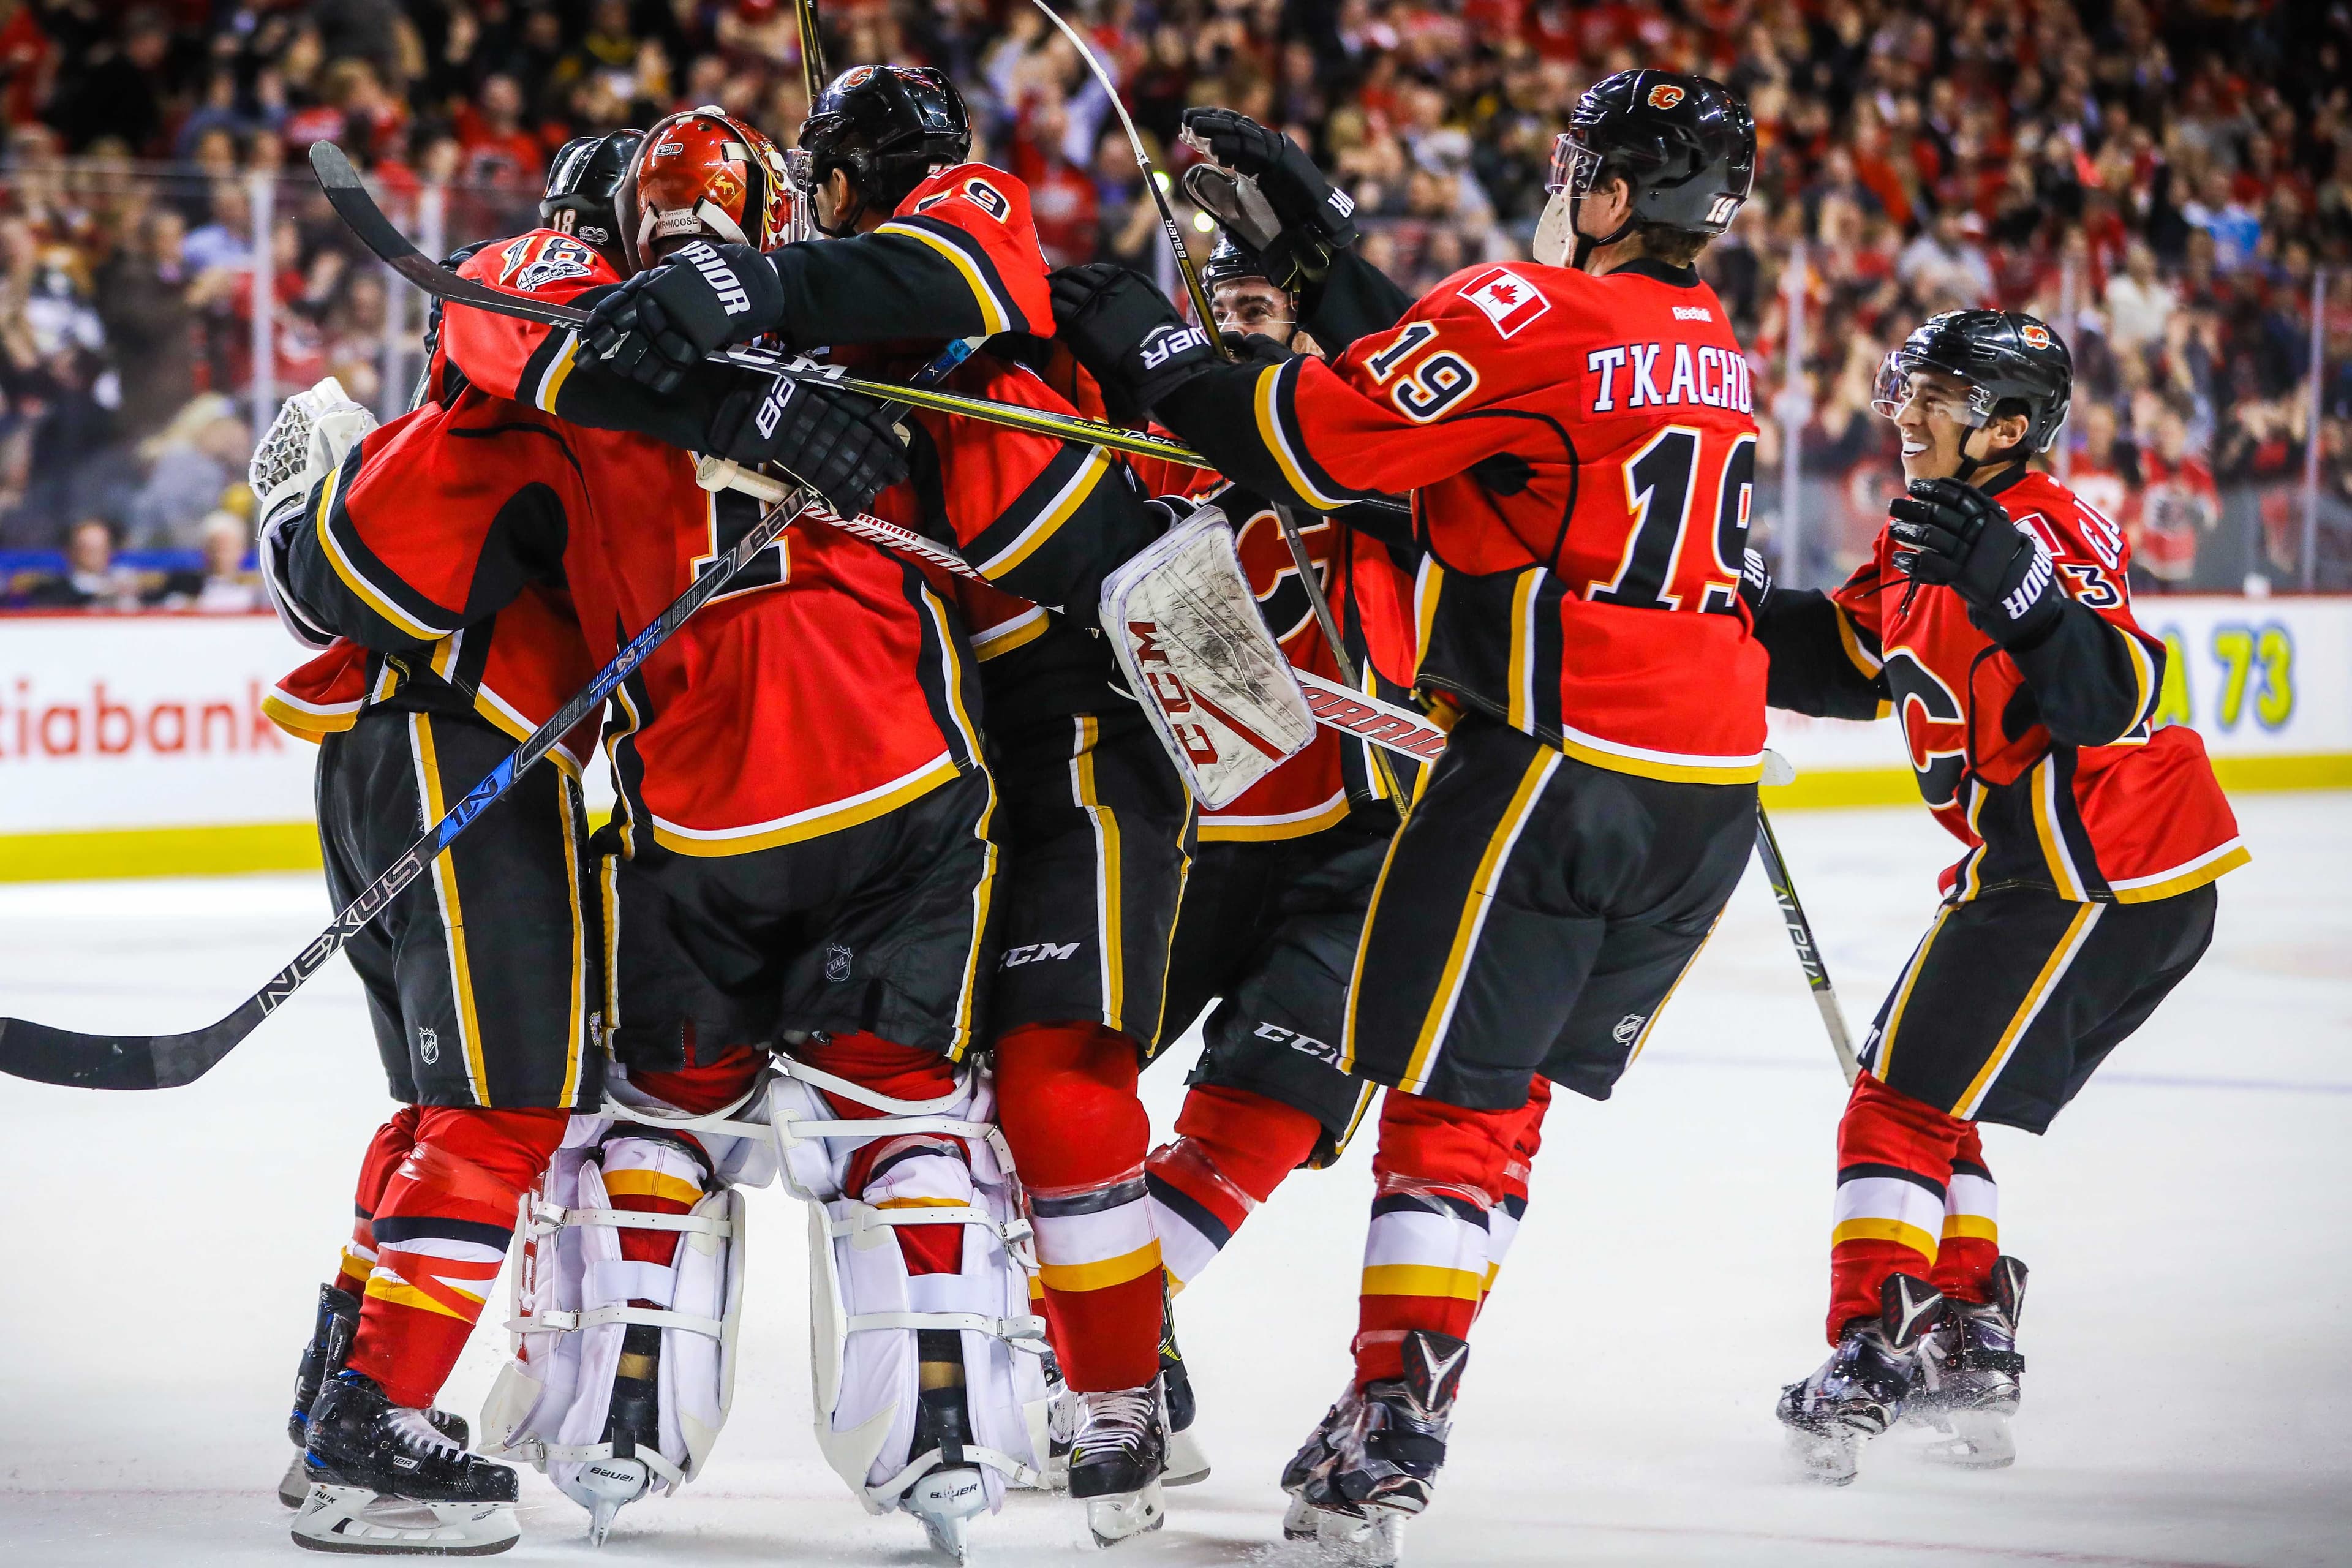
Photo credit: Sergei Belski/USA Today

Sep 12, 2017, 10:00 EDTUpdated: Sep 10, 2017, 22:27 EDT
As this offseason comes to a close, many of us eagerly await what’s to come in the 2017-18 season. True to any season, it’s impossible to predict what will unfold, but that doesn’t stop people from trying. Whether it’s using predictive models using years of data or simply trying to draft the best fantasy roster possible, guessing how the season will pan out is part of what makes being a hockey fan fun.
Before we delve into our post, we’d like to formally introduce ourselves. We are Bill Tran (@mrbilltran) and Karim Kurji (@karimkurji) and we are excited to be part of the FlamesNation team. If you’d like to check out some of our other work, find us at thewincolumn.ca and @wincolumnblog.
The statistical analysis of hockey is an ever-growing field. With the immense number of metrics available, navigating through the sea of data is often daunting. Comparing statistics and trying to find correlations is difficult as new data and analysis is added to the picture. We created a new visualization where we focused on various factors and outcomes associated with individual games.
The plots show a high level visualization of the data and we tried to find correlations between them. The idea is that these plots are modular so that comparisons between different sets of data is easy to do. As a starting point, we chose four metrics to look at from last season: win-loss record, starting goaltender, man games lost, and home-away split. To make things easier to interpret, we broke the season into 20-game sections.
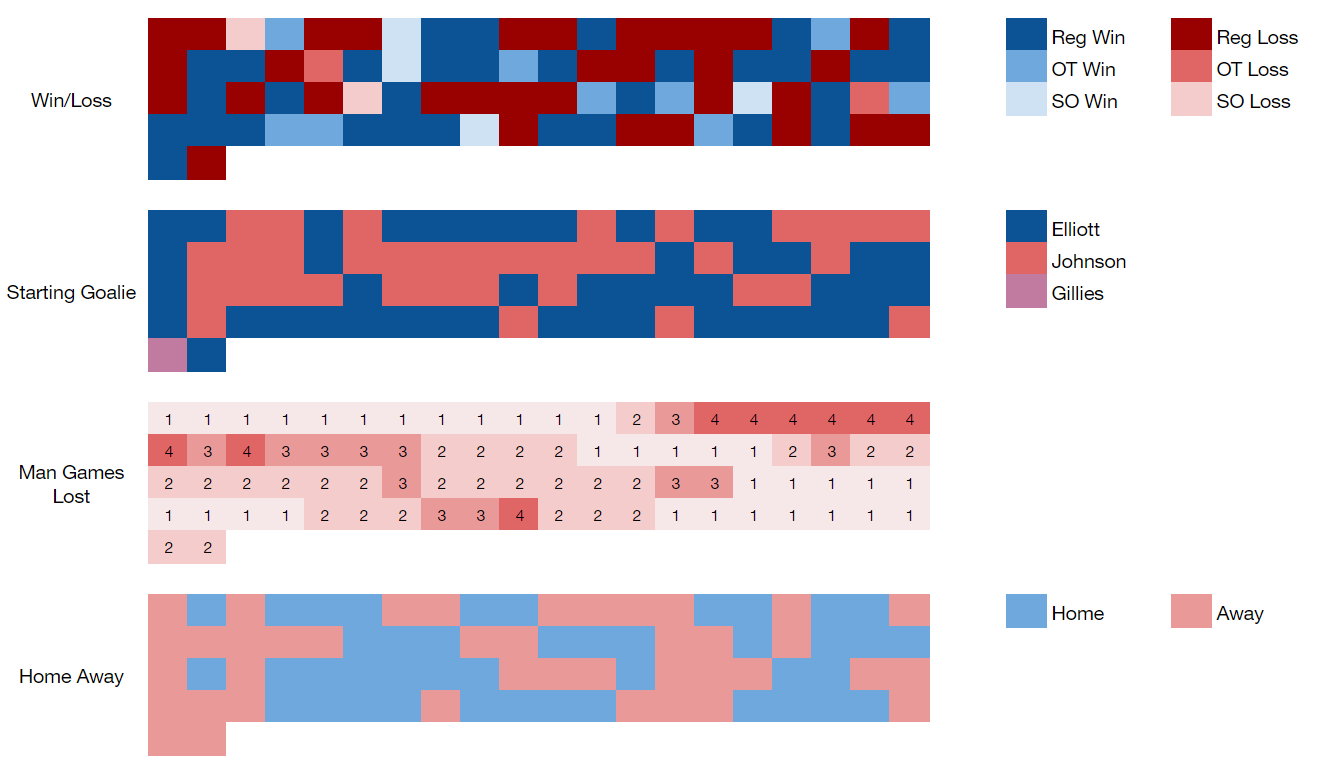
A few interesting things become immediately visible when data is presented this way.
- The Flames’ franchise-tying 10-game win streak came to an end in game 70. This game saw Chad Johnson start in goal instead of Brian Elliott, who was out with the flu. Perhaps these factors played a role in ending that historic run.
- Between games 14 and 25, the Flames were dreadful, only winning five out of a possible 12 games. This also happened to be the stretch of games where they were most injured, averaging between three and four injured players a night. One of those injured players was Johnny Gaudreau who was out with a broken finger.
- Late in the year, Elliott finally established himself as the true starting goaltender. The Flames only lost seven times in their final 23 games. However, three of those losses came from four Johnson starts. That just goes to show that the goaltending duo was never quite simultaneously able to put up wins, but the right person manned the pipes often enough to get the Flames into the postseason.
All of these observations were made using just the four plots in combination with each other. The goal was to provide an easy way to interpret data, and this may be a great tool to do so moving forward. There are many more correlations than the ones we’ve made so take a deeper look at the plots and see what you can find.
If you’re interested in seeing how the Flames stacked up against the rest of the league, check out our post on The Win Column where we dive into the data set for all 30 teams.
Recent articles from Karim Kurji & Bill Tran
Breaking News
- Flames Prospect Roundup: How the standings shape up entering the holiday break
- NHL Notebook: Sidney Crosby takes sole possession of most points in Penguins’ franchise history
- FlamesNation Mailbag: Waiting for Santa with reader questions
- Flames injury news: positive signs for Martin Pospisil
- Recap: Martin Frk leads Wranglers to memorable Winter Wranglerfest win in more ways than one